


A Maxwell’s velocity distribution curve area under the graph
A. Increases when temperature is increased
B. Decreases when temperature is increased
C. Remains same at all temperature
D. Depends on the pressure of the gas
Answer
584.7k+ views
Hint: Maxwell’s distribution tells about the fraction of molecules of a given gas having a particular speed. The Maxwell’s distribution curve is a graph of the number of gas molecules versus the velocity that a molecule can have. The area under the curve represents the total number of molecules of the given gas.
Complete answer:
Let us first understand what a Maxwell’s distribution curve is.
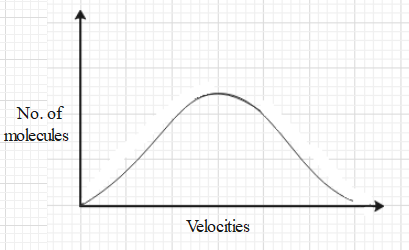
Maxwell’s distribution tells about the fraction of molecules of a given gas having a particular speed. The Maxwell’s distribution curve is a graph of the number of gas molecules versus the velocity that a molecule can have.
The y axis represents the number of molecules and the x axis represents the velocity of the molecules.
If we want to find out what fraction of the total number of molecules have a certain speed at a given temperature then it can be done with the help of the graph.
Let us discuss the area under the curve. In this graph, the area under the curve will be equivalent to calculating the molecules of all the possible velocities. Therefore, the area under the curve represents the total number of molecules of the given gas.
However, the number of molecules is an independent quantity. Therefore, the number of molecules of a given gas will remain the same irrespective of the change in temperature.
So, the correct answer is “Option C”.
Note:
Note that the shape of the curve changes with the change in temperature. This is because the velocities of the gas molecules depend on the temperature. When the temperature is increased, the velocities of the gas molecules increase.
Hence, for a given gas the Maxwell’s distribution curve is different at different temperatures. However, the area under the curve is equal for all.
Complete answer:
Let us first understand what a Maxwell’s distribution curve is.
Maxwell’s distribution tells about the fraction of molecules of a given gas having a particular speed. The Maxwell’s distribution curve is a graph of the number of gas molecules versus the velocity that a molecule can have.
The y axis represents the number of molecules and the x axis represents the velocity of the molecules.
If we want to find out what fraction of the total number of molecules have a certain speed at a given temperature then it can be done with the help of the graph.
Let us discuss the area under the curve. In this graph, the area under the curve will be equivalent to calculating the molecules of all the possible velocities. Therefore, the area under the curve represents the total number of molecules of the given gas.
However, the number of molecules is an independent quantity. Therefore, the number of molecules of a given gas will remain the same irrespective of the change in temperature.
So, the correct answer is “Option C”.
Note:
Note that the shape of the curve changes with the change in temperature. This is because the velocities of the gas molecules depend on the temperature. When the temperature is increased, the velocities of the gas molecules increase.
Hence, for a given gas the Maxwell’s distribution curve is different at different temperatures. However, the area under the curve is equal for all.
Recently Updated Pages
Master Class 11 Computer Science: Engaging Questions & Answers for Success
Master Class 11 Business Studies: Engaging Questions & Answers for Success
Master Class 11 Economics: Engaging Questions & Answers for Success
Master Class 11 English: Engaging Questions & Answers for Success
Master Class 11 Maths: Engaging Questions & Answers for Success
Master Class 11 Biology: Engaging Questions & Answers for Success
Trending doubts
One Metric ton is equal to kg A 10000 B 1000 C 100 class 11 physics CBSE
There are 720 permutations of the digits 1 2 3 4 5 class 11 maths CBSE
Discuss the various forms of bacteria class 11 biology CBSE
Draw a diagram of a plant cell and label at least eight class 11 biology CBSE
State the laws of reflection of light
Explain zero factorial class 11 maths CBSE