


A __________ graph is a chart that uses either horizontal or vertical bars to show comparisons of companies’ profit.
A) Line
B) Pie
C) Bar
D) Polygon
Answer
515.7k+ views
Hint: Here in this question we have been asked to tell the name of a graph that represents a chart which uses either horizontal or vertical bars to show comparisons of companies’ profit. We have been given 4 different options. For answering this question we will define the options.
Complete step by step solution:
Now considering from the question we have been asked to fill in the blank with the name of a graph that represents a chart which uses either horizontal or vertical bars to show comparisons of companies’ profit.
A line graph is defined as a chart that uses a straight line to represent the information.
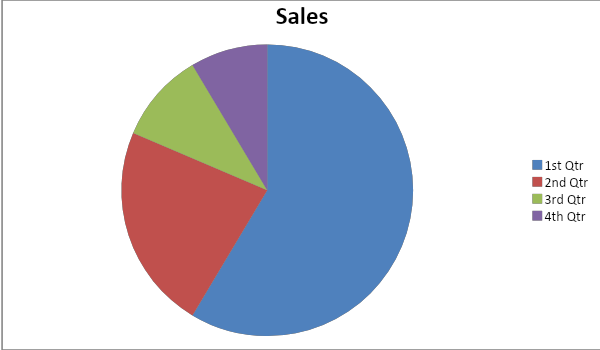
A pie graph is defined as a chart that represents the information in a form of pie or circle.
For example a pie graph is shown below:
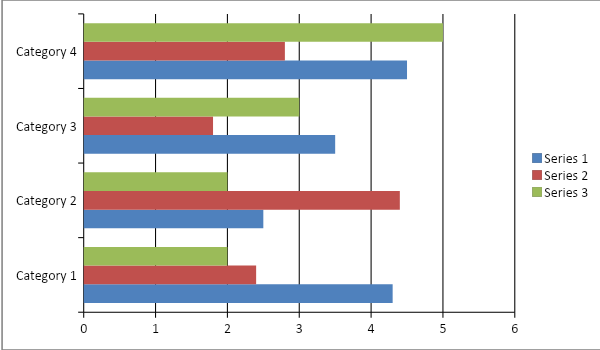
A bar graph is defined as a chart that uses either horizontal or vertical bars to show comparisons.
For example a bar graph is shown below:
A polygon graph is defined as a chart that represents the information in the form of a polygon.
Therefore we can conclude that the option C should be marked as correct.
Note: During the process of answering questions of this type we should be sure with the concepts that we are going to apply. This is a very simple and easy question which can be answered in a short span of time. This is a pure theoretical question. Very few mistakes are possible in questions of this type. If someone is not sure with the concepts then they may make a committee mistake.
Complete step by step solution:
Now considering from the question we have been asked to fill in the blank with the name of a graph that represents a chart which uses either horizontal or vertical bars to show comparisons of companies’ profit.
A line graph is defined as a chart that uses a straight line to represent the information.
A pie graph is defined as a chart that represents the information in a form of pie or circle.
For example a pie graph is shown below:
A bar graph is defined as a chart that uses either horizontal or vertical bars to show comparisons.
For example a bar graph is shown below:
A polygon graph is defined as a chart that represents the information in the form of a polygon.
Therefore we can conclude that the option C should be marked as correct.
Note: During the process of answering questions of this type we should be sure with the concepts that we are going to apply. This is a very simple and easy question which can be answered in a short span of time. This is a pure theoretical question. Very few mistakes are possible in questions of this type. If someone is not sure with the concepts then they may make a committee mistake.
Recently Updated Pages
Master Class 8 Social Science: Engaging Questions & Answers for Success
Master Class 8 English: Engaging Questions & Answers for Success
Class 8 Question and Answer - Your Ultimate Solutions Guide
Master Class 8 Maths: Engaging Questions & Answers for Success
Master Class 8 Science: Engaging Questions & Answers for Success
Master Class 7 English: Engaging Questions & Answers for Success
Trending doubts
What is BLO What is the full form of BLO class 8 social science CBSE
Citizens of India can vote at the age of A 18 years class 8 social science CBSE
Full form of STD, ISD and PCO
Advantages and disadvantages of science
Right to vote is a AFundamental Right BFundamental class 8 social science CBSE
What are the 12 elements of nature class 8 chemistry CBSE