


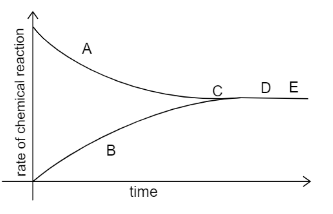
A graph given below deals with the reversible reaction.
What inference can be drawn about the concentration of the reactants and products at the point D and E?
Answer
508.8k+ views
Hint: The graph given to us is the rate v/s time graph. We can consider two reactions forward and backward. At equilibrium we say that the rate of forward reaction is equal to the rate of backward reaction i.e. the rate at which reactants turn into products and vice versa are the same.
Complete answer:
The use of graphs to represent the equilibrium reactions are commonly used. There are two types of graphs used to represent the equilibrium:
1. Rate-time graph
2. mole-time or concentration-time graph
The graph given to us is the Rate-time graph. In the rate time graph the rate of forward reaction is equal to the rate of backward reaction, then the equilibrium is attained. Consider the curve A to be the forward reaction and curve B to be the backward reaction. As time proceeds we see that both curves mingle at point C. This is the point at which equilibrium is attained. Further on, the reaction continues to be in the equilibrium state.
Points D and E are beyond point C, hence we can say that the conc of products and reactants will have no change since it has already attained equilibrium at point C.
Note:
The other type of graph i.e. concentration-time graph, the equilibrium is attained when the concentrations of the reactants and products become constant. The values of these may not be the same, but the moles of reactants and products will be equal. The graph can be shown as:
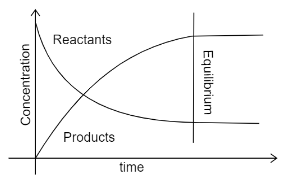
Here the straight lines indicate that the concentrations have become constant and equilibrium is achieved.
Complete answer:
The use of graphs to represent the equilibrium reactions are commonly used. There are two types of graphs used to represent the equilibrium:
1. Rate-time graph
2. mole-time or concentration-time graph
The graph given to us is the Rate-time graph. In the rate time graph the rate of forward reaction is equal to the rate of backward reaction, then the equilibrium is attained. Consider the curve A to be the forward reaction and curve B to be the backward reaction. As time proceeds we see that both curves mingle at point C. This is the point at which equilibrium is attained. Further on, the reaction continues to be in the equilibrium state.
Points D and E are beyond point C, hence we can say that the conc of products and reactants will have no change since it has already attained equilibrium at point C.
Note:
The other type of graph i.e. concentration-time graph, the equilibrium is attained when the concentrations of the reactants and products become constant. The values of these may not be the same, but the moles of reactants and products will be equal. The graph can be shown as:
Here the straight lines indicate that the concentrations have become constant and equilibrium is achieved.
Recently Updated Pages
Master Class 9 General Knowledge: Engaging Questions & Answers for Success
Master Class 9 Maths: Engaging Questions & Answers for Success
Master Class 9 Science: Engaging Questions & Answers for Success
Master Class 9 English: Engaging Questions & Answers for Success
Master Class 9 Social Science: Engaging Questions & Answers for Success
Class 9 Question and Answer - Your Ultimate Solutions Guide
Trending doubts
One Metric ton is equal to kg A 10000 B 1000 C 100 class 11 physics CBSE
Difference Between Prokaryotic Cells and Eukaryotic Cells
Two of the body parts which do not appear in MRI are class 11 biology CBSE
1 ton equals to A 100 kg B 1000 kg C 10 kg D 10000 class 11 physics CBSE
10 examples of friction in our daily life
Name the Largest and the Smallest Cell in the Human Body ?