


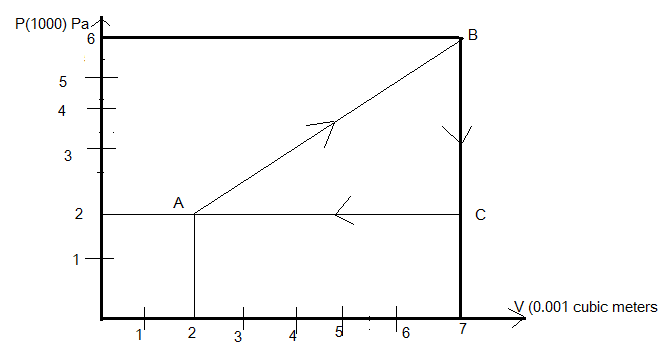
A gas is taken through the cycle A B C A, as shown. What is the net work done by the gas?
A. 3000J
B. 1000J
C. Zero
D. 2000J
Answer
640.2k+ views
Hint: The product of pressure and volume is represented by an area on the p-v diagram. The area under this curve tells us the work done during a thermodynamic process. In this process it can be found out by calculating the area of the curve this is a simple and quick method.
The curve showing the variation of volume of a substance along the x-axis and the variation of the pressure along the y-axis is the P-V diagram.
In this question first, find the total change in volume along the x-axis and change in pressure along the y-axis and then find the work done under the curve.
Complete step by step solution:
Given that the gas is going through the curve ABCA

Where the change in volume takes place from \[2 \times {10^{ - 3}}{m^3}\]to \[7 \times {10^{ - 3}}{m^3}\]along positive x-axis and pressure changes from \[2 \times {10^5}Pa\] to \[6 \times {10^5}Pa\] along the y-direction.
Hence,
\[\vartriangle V = 5 \times {10^{ - 3}}{m^3}\]
\[\vartriangle P = 4 \times {10^5}Pa\]
So the area under the curve for the total work done will be equal to
Net work is done = area under the curve A B C
\[
W = \dfrac{1}{2} \times 5 \times {10^{ - 3}} \times 4 \times {10^5} \\
= \dfrac{1}{2} \times 5 \times 4 \times {10^2} \\
= 10 \times {10^2} \\
= 1000J \\
\]
Hence the total work is done by the gas under the curve =1000J
Option (B) is correct.
Note: Students should be careful in some cases where in some cases specific volume is plotted along the x-axis instead of volume; in such cases area under the curve represents work per unit mass of the working fluid given as J/Kg.
The curve showing the variation of volume of a substance along the x-axis and the variation of the pressure along the y-axis is the P-V diagram.
In this question first, find the total change in volume along the x-axis and change in pressure along the y-axis and then find the work done under the curve.
Complete step by step solution:
Given that the gas is going through the curve ABCA
Where the change in volume takes place from \[2 \times {10^{ - 3}}{m^3}\]to \[7 \times {10^{ - 3}}{m^3}\]along positive x-axis and pressure changes from \[2 \times {10^5}Pa\] to \[6 \times {10^5}Pa\] along the y-direction.
Hence,
\[\vartriangle V = 5 \times {10^{ - 3}}{m^3}\]
\[\vartriangle P = 4 \times {10^5}Pa\]
So the area under the curve for the total work done will be equal to
Net work is done = area under the curve A B C
\[
W = \dfrac{1}{2} \times 5 \times {10^{ - 3}} \times 4 \times {10^5} \\
= \dfrac{1}{2} \times 5 \times 4 \times {10^2} \\
= 10 \times {10^2} \\
= 1000J \\
\]
Hence the total work is done by the gas under the curve =1000J
Option (B) is correct.
Note: Students should be careful in some cases where in some cases specific volume is plotted along the x-axis instead of volume; in such cases area under the curve represents work per unit mass of the working fluid given as J/Kg.
Recently Updated Pages
Basicity of sulphurous acid and sulphuric acid are
Master Class 11 English: Engaging Questions & Answers for Success
Master Class 11 Physics: Engaging Questions & Answers for Success
Master Class 11 Computer Science: Engaging Questions & Answers for Success
Master Class 11 Chemistry: Engaging Questions & Answers for Success
Master Class 11 Social Science: Engaging Questions & Answers for Success
Trending doubts
Difference Between Prokaryotic Cells and Eukaryotic Cells
Two of the body parts which do not appear in MRI are class 11 biology CBSE
One Metric ton is equal to kg A 10000 B 1000 C 100 class 11 physics CBSE
10 examples of friction in our daily life
Draw a diagram of nephron and explain its structur class 11 biology CBSE
What will happen if the mucus is not secreted by the class 11 biology CBSE