


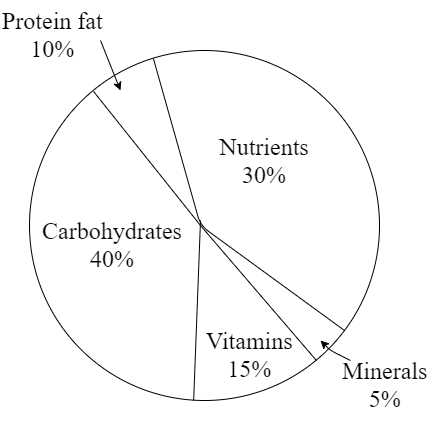
A food contains the following nutrients. Draw a pie chart representing the data.
Nutrients, protein fat, carbohydrates, vitamins, mineral percentage are$30\% ,10\% ,40\% ,15\% ,5\% $.
Answer
574.5k+ views
Hint: For drawing the pie chart, we need to find the value in the form of an angle so first, we will find the angle value for every object then we will divide the angle in the part of angles.
Complete step by step Solution:
Now the given values for various objects are the $30\%,10\%,40\%,15\%,5\% $ in which we have five different objects which are Nutrients, protein fat, carbohydrates, vitamins, minerals.
So, we have Nutrients$ = 30\% $, protein fat $ = 10\% $ , carbohydrates $ = 40\% $, vitamins $ = 15\% $,
mineral $ = 5\% $
Now we know that a circle has the angle of ${360^ \circ }$ and our given data in the form of percentage
And we know that always percentage calculate on $100\% $
So now we will compare both percentage and the angle of circle then we will get the value of $1\% $ which we will put in given percentage value so we will get the angle for each object then we will draw the section of every object with help of angles which our pie chart which we want for our question
Now the value of $1\% $ is the $100\% = {360^ \circ }$ then
We will get the value of $1\% $ which is $1\% = \dfrac{{{{360}^ \circ }}}{{100}}$
Now we find the angle value for each object so first we will calculate for
Nutrients$ = 30\% = 30 \times \dfrac{{{{360}^ \circ }}}{{100}} = {108^ \circ }$
Now we will calculate for the
Protein fat$ = 10\% = 10 \times \dfrac{{{{360}^ \circ }}}{{100}} = {36^ \circ }$
Now we will calculate for the
Carbohydrates$ = 40\% = 40 \times \dfrac{{{{360}^ \circ }}}{{100}} = {144^ \circ }$
Now we will calculate for the
Vitamins$ = 15\% = 15 \times \dfrac{{{{360}^ \circ }}}{{100}} = {54^ \circ }$
Now we will calculate for the
Mineral$ = 5\% = 5 \times \dfrac{{{{360}^ \circ }}}{{100}} = {18^ \circ }$
Now we will draw the pie chart for the given object by using the angle values which we have get
After drawing the pie chart, we will get
Note:
if want to draw the pie chart for given data first we need to find the all value in the form of angle for a quick solution we can use direct value for a percentage to angle conversion which is $1\% = {\dfrac{{18}}{5}^ \circ }$ by using this value we will get our angle value directly then we can draw our pie chart quickly.
Recently Updated Pages
Three beakers labelled as A B and C each containing 25 mL of water were taken A small amount of NaOH anhydrous CuSO4 and NaCl were added to the beakers A B and C respectively It was observed that there was an increase in the temperature of the solutions contained in beakers A and B whereas in case of beaker C the temperature of the solution falls Which one of the following statements isarecorrect i In beakers A and B exothermic process has occurred ii In beakers A and B endothermic process has occurred iii In beaker C exothermic process has occurred iv In beaker C endothermic process has occurred
Master Class 10 Social Science: Engaging Questions & Answers for Success
Master Class 10 Science: Engaging Questions & Answers for Success
Master Class 10 Maths: Engaging Questions & Answers for Success
Master Class 10 General Knowledge: Engaging Questions & Answers for Success
Master Class 10 Computer Science: Engaging Questions & Answers for Success
Three beakers labelled as A B and C each containing 25 mL of water were taken A small amount of NaOH anhydrous CuSO4 and NaCl were added to the beakers A B and C respectively It was observed that there was an increase in the temperature of the solutions contained in beakers A and B whereas in case of beaker C the temperature of the solution falls Which one of the following statements isarecorrect i In beakers A and B exothermic process has occurred ii In beakers A and B endothermic process has occurred iii In beaker C exothermic process has occurred iv In beaker C endothermic process has occurred
Master Class 10 Social Science: Engaging Questions & Answers for Success
Master Class 10 Science: Engaging Questions & Answers for Success
Trending doubts
Explain the Treaty of Vienna of 1815 class 10 social science CBSE
In cricket, what is the term for a bowler taking five wickets in an innings?
Who Won 36 Oscar Awards? Record Holder Revealed
What is the median of the first 10 natural numbers class 10 maths CBSE
Why is it 530 pm in india when it is 1200 afternoon class 10 social science CBSE
What is deficiency disease class 10 biology CBSE