


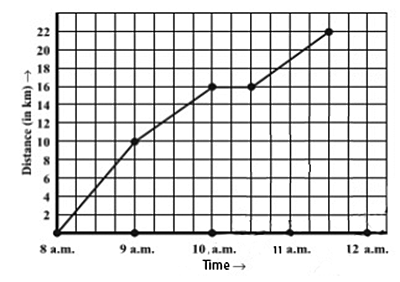
A courier-person cycles from a town to a neighboring suburban area to deliver a parcel to a merchant. His distance from the town at different times is shown by the following graph.
a) What is the scale taken for the time axis?
b) How much time did the person take for the trip?
c) How far is the place of the merchant from the town?
d) Did the person stop on his way? Explain.
e) During which period did he ride fastest?

Answer
615.3k+ views
Hint: By using the given data and observing the given graph we will define the variable in the $ x-axis $ .
To calculate the time taken by the courier-person we will calculate the difference between the limits of variable time shown in the graph. To calculate the distance travelled by the courier-person we will find the coordinates of the end point in the graph, from the coordinates based on the scale of the graph we will get the distance. If the courier person is stopped i.e. there is no change in movement, so we will observe no change in distance. We can calculate the speed of the vehicle easily because the interval between the two points is the unit time and we will compare the four speeds of the courier person to get the fastest speed.
Complete step-by-step answer:
Given that,
a) We can observe the scale of the graph as
b) In the graph we have $ 4 $ intervals and the difference between each interval is $ 1hr $ , so the time taken by courier person to travel is $ 4\times 1hr=4hr $
c) We can say that the coordinates of the end point in the graph as $ \left( 12,22 \right) $ , in the graph we taken distance on the $ y-axis $ hence the $ y-coordinate $ represents the total distance traveled by courier person i.e. $ 22km $
d) If the person stopped his journey, there would be no movement. If there is no movement the graph shows a horizontal flat line. We can observe the horizontal flat line in the interval of $ 10am-11am $ . So, the person stopped on the way.
e) We can say that the person travelled
$ 10km $ in the interval $ 8am-9m $ i.e. $ 10km $ per hour
$ 16-10=6km $ in the interval $ 9am-10am $ i.e. $ 6km $ per hour
$ 19-16=3km $ in the interval $ 10am-11am $ I.e. $ 3km $ per hour
$ 22-19=3km $ in the interval $ 11am-12am $ i.e. $ 3km $ per hour
From the above data we can say that the courier person traveled the interval $ 8am-9am $ quickly.
Note: Reading the graphs will be helpful for this kind of problem. It is better to note all the recordings/values from the graph at a place without confusion.
To calculate the time taken by the courier-person we will calculate the difference between the limits of variable time shown in the graph. To calculate the distance travelled by the courier-person we will find the coordinates of the end point in the graph, from the coordinates based on the scale of the graph we will get the distance. If the courier person is stopped i.e. there is no change in movement, so we will observe no change in distance. We can calculate the speed of the vehicle easily because the interval between the two points is the unit time and we will compare the four speeds of the courier person to get the fastest speed.
Complete step-by-step answer:
Given that,
a) We can observe the scale of the graph as
On $ x-axis $ $ 4cm=1hr $
On $ y-axis $ $ 1cm=2km $
Hence the scale of the time on $ x-axis $ is $ 4cm=1hr $
b) In the graph we have $ 4 $ intervals and the difference between each interval is $ 1hr $ , so the time taken by courier person to travel is $ 4\times 1hr=4hr $
c) We can say that the coordinates of the end point in the graph as $ \left( 12,22 \right) $ , in the graph we taken distance on the $ y-axis $ hence the $ y-coordinate $ represents the total distance traveled by courier person i.e. $ 22km $
d) If the person stopped his journey, there would be no movement. If there is no movement the graph shows a horizontal flat line. We can observe the horizontal flat line in the interval of $ 10am-11am $ . So, the person stopped on the way.
e) We can say that the person travelled
$ 10km $ in the interval $ 8am-9m $ i.e. $ 10km $ per hour
$ 16-10=6km $ in the interval $ 9am-10am $ i.e. $ 6km $ per hour
$ 19-16=3km $ in the interval $ 10am-11am $ I.e. $ 3km $ per hour
$ 22-19=3km $ in the interval $ 11am-12am $ i.e. $ 3km $ per hour
From the above data we can say that the courier person traveled the interval $ 8am-9am $ quickly.
Note: Reading the graphs will be helpful for this kind of problem. It is better to note all the recordings/values from the graph at a place without confusion.
Recently Updated Pages
Master Class 12 Economics: Engaging Questions & Answers for Success
Master Class 12 English: Engaging Questions & Answers for Success
Master Class 12 Social Science: Engaging Questions & Answers for Success
Master Class 12 Maths: Engaging Questions & Answers for Success
Master Class 12 Physics: Engaging Questions & Answers for Success
Master Class 9 General Knowledge: Engaging Questions & Answers for Success
Trending doubts
One Metric ton is equal to kg A 10000 B 1000 C 100 class 11 physics CBSE
Difference Between Prokaryotic Cells and Eukaryotic Cells
Find the value of the expression given below sin 30circ class 11 maths CBSE
Two of the body parts which do not appear in MRI are class 11 biology CBSE
1 ton equals to A 100 kg B 1000 kg C 10 kg D 10000 class 11 physics CBSE
Draw a diagram of nephron and explain its structur class 11 biology CBSE