


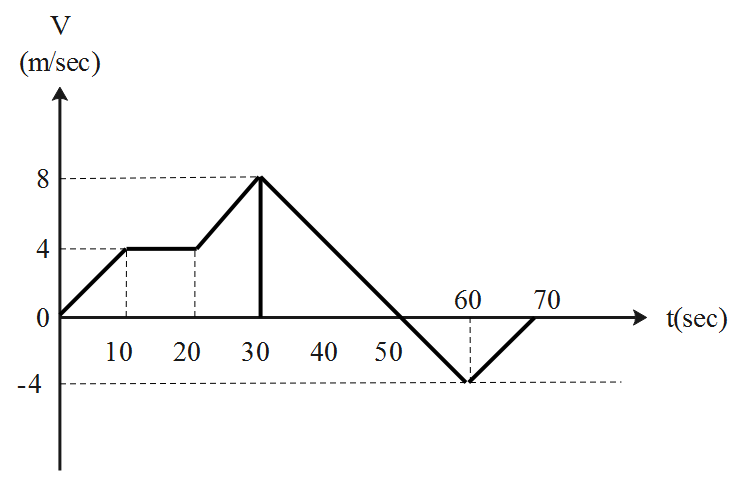
A car is moving on a straight road. The velocity of the car varies with time as shown in figure. Initially (at \[t=0\]), the car was at x=0, where, x is the position of the car at any time t. Average speed from \[t=0\]tot \[t=70s\]will be:
Answer
554.4k+ views
Hint: The velocity time graph gives the displacement. When the slope of the velocity time graph will be above the x-axis, then, the displacement is considered to be positive. Similarly, when the slope of the velocity time graph will be below the x-axis, then, the displacement is considered to be negative.
Formula used:
\[\text{Average speed}=\dfrac{\text{Total distance}}{\text{Total time}}\]
Complete step-by-step solution:
From the given information, we have the data as follows.
The displacement is positive till the curve crosses the x-axis at 50 seconds, after this time, the displacement is negative, as the curve is below the x-axis. Thus, the positive displacements get added up, while the negative ones get subtracted.
The formula for computing the average speed is,
\[\text{Average speed}=\dfrac{\text{Total distance}}{\text{Total time}}\]
The maximum displacement equals the area under the curve till the time 50 seconds. This area equals the sum of the area of the triangle till the time 10 seconds and the area of the rectangle from time 10 seconds till 20 seconds and the area of the trapezium from the time 20 seconds till the time 30 seconds and the area of the triangle from the time 30 seconds till 50 seconds.
Substitute the values in the above formula
\[\text{Average speed}=\dfrac{{}^{1}/{}_{2}\times 10\times 4+20\times 4+{}^{1}/{}_{2}\times 10\times 4+{}^{1}/{}_{2}\times 20\times 8+{}^{1}/{}_{2}\times 20\times 4}{70}\]
Continue further computation.
\[\begin{align}
& \text{Average speed}=\dfrac{20+80+20+80+40}{70} \\
& \Rightarrow \text{Average speed}=\dfrac{240}{70} \\
& \therefore \text{Average speed}=3.42\,{m}/{s}\; \\
\end{align}\]
\[\therefore \] The average speed of a car moving on a straight road will be, \[3.42\,{m}/{s}\;\].
Note: There are different types of graph considering the parameters of the motion with respect to the time, such as, the displacement time graph, velocity time graph and the acceleration time graph. The slope of the displacement time graph gives the velocity, the slope of the velocity time graph gives the acceleration and slope of the acceleration time graph gives the change in the velocity.
Recently Updated Pages
Master Class 12 Economics: Engaging Questions & Answers for Success
Master Class 12 English: Engaging Questions & Answers for Success
Master Class 12 Social Science: Engaging Questions & Answers for Success
Master Class 12 Maths: Engaging Questions & Answers for Success
Master Class 12 Physics: Engaging Questions & Answers for Success
Master Class 11 Social Science: Engaging Questions & Answers for Success
Trending doubts
One Metric ton is equal to kg A 10000 B 1000 C 100 class 11 physics CBSE
Difference Between Prokaryotic Cells and Eukaryotic Cells
Two of the body parts which do not appear in MRI are class 11 biology CBSE
1 ton equals to A 100 kg B 1000 kg C 10 kg D 10000 class 11 physics CBSE
Draw a diagram of nephron and explain its structur class 11 biology CBSE
10 examples of friction in our daily life