


A bubble gum company visited a school. They wanted to find out how many children liked their product which was called “Big Fun”. They visited Class III, IV and V and collected the following data.
Class III- 300 students
Class IV- 100 students
Class V- 200 students
Sort this data in the form of a table and then represent it using a pictograph, bar graph and pie cart.
Answer
575.4k+ views
Hint: We have to understand the basic difference or method of representing in a table, a pictograph, a bar graph and a pie chart. And in all the four means we have to consider the whole question as just two parts, one the Class III, IV & V and second the no of students liked the product according to their respective class.
Complete step-by-step answer:
At first we have to understand the meaning of all the four means of representing any data.
Table
Pictograph
Bar graph
Pie Chart
Table: A table is used to display a set of facts or figures systematically, especially in the form of columns and rows.
Pictograph: A pictorial representation of statistics on a chart, graph or computer screen.
Bar graph: A diagram in which the numerical values of variables are represented by the height or length of lines or rectangles of equal width.
Pie chart: A type of graph in which a circle is divided into sectors that each represent a proportion of the whole.
Now from the question we can understand that we have to represent the number of students of the respective class who liked the product called “Big Fun”. And since data of 3 classes is given, in all the forms the data will be represented in three parts as below.
Product: Big Fun
Data given in the question:
Class III- 300 students
Class IV- 100 students
Class V- 200 students
TABLE:
Pictograph:

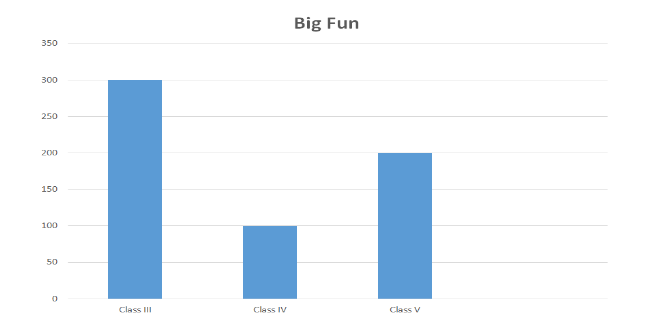
Bar Graph:
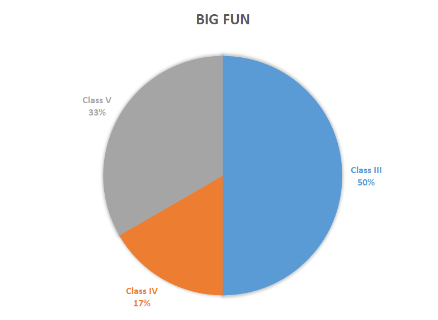
Pie Chart:
Note: Kindly remember a small point that in all the above 4 forms we have taken individual values only and not cumulative value. Though it’s a small point, sometimes it may create a big confusion and can land you in a big mess, so always represent using the individual values only no matter how many individual values are given.
Complete step-by-step answer:
At first we have to understand the meaning of all the four means of representing any data.
Table
Pictograph
Bar graph
Pie Chart
Table: A table is used to display a set of facts or figures systematically, especially in the form of columns and rows.
Pictograph: A pictorial representation of statistics on a chart, graph or computer screen.
Bar graph: A diagram in which the numerical values of variables are represented by the height or length of lines or rectangles of equal width.
Pie chart: A type of graph in which a circle is divided into sectors that each represent a proportion of the whole.
Now from the question we can understand that we have to represent the number of students of the respective class who liked the product called “Big Fun”. And since data of 3 classes is given, in all the forms the data will be represented in three parts as below.
Product: Big Fun
Data given in the question:
Class III- 300 students
Class IV- 100 students
Class V- 200 students
TABLE:
| Product- Big Fun | ||
| Sl No | Class | No of Students |
| 1 | Class III | 300 |
| 2 | Class IV | 100 |
| 3 | Class V | 200 |
Pictograph:
Bar Graph:
Pie Chart:
Note: Kindly remember a small point that in all the above 4 forms we have taken individual values only and not cumulative value. Though it’s a small point, sometimes it may create a big confusion and can land you in a big mess, so always represent using the individual values only no matter how many individual values are given.
Recently Updated Pages
Master Class 9 General Knowledge: Engaging Questions & Answers for Success
Master Class 9 Social Science: Engaging Questions & Answers for Success
Master Class 9 English: Engaging Questions & Answers for Success
Master Class 9 Maths: Engaging Questions & Answers for Success
Master Class 9 Science: Engaging Questions & Answers for Success
Class 9 Question and Answer - Your Ultimate Solutions Guide
Trending doubts
Find the mode and median of the data 13 16 12 14 1-class-9-maths-CBSE
What were the main changes brought about by the Bolsheviks class 9 social science CBSE
What is the theme or message of the poem The road not class 9 english CBSE
What are the major achievements of the UNO class 9 social science CBSE
Explain the importance of pH in everyday life class 9 chemistry CBSE
Differentiate between parenchyma collenchyma and sclerenchyma class 9 biology CBSE