


A block of mass m is placed on an inclined plane with an angle of inclination $\theta $. Let N, $f_L$, and F represent the normal reaction, limiting force of friction and the net force down the inclined plane respectively. Let $\mu $ the coefficient of friction. The dependence of N, FL, and F on $\theta $ is indicated by plotting graphs as shown below. Then curve (1), (2), and (3) respectively represent
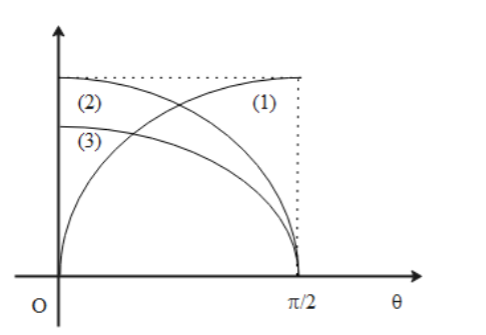
A. N, F, and $f_L$
B. $f_L$, F, and N
C. F, N and $f_L$
D. $f_L$, N, and F
Answer
628.5k+ views
Hint: There are two conditions for a body one is balanced and another is an unbalanced condition. Under balance conditions, all the forces which are acting on the object influence each other, and the net force becomes zero. On the other hand, when the object is in unbalanced condition one of the forces outstand the other forces and change in the position of the object can be seen.
Complete step-by-step answer:
When an object is placed on an inclined plane the forces faced by the object are given by the free body diagram
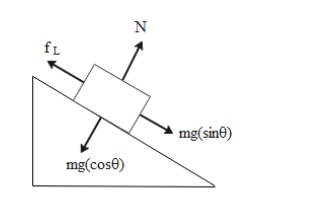
From the figure we can say that:
The force normal to the object is equivalent to the cos component of the downward force mg. mathematically,
$N=mg\cos \theta $
The value of $\cos \theta $decreases with the increase in the value of$\theta $.
So we can say that N is inversely proportional to $\theta $
$N\propto \dfrac{1}{\theta }$
So the plot (2) or (3) will be the plotting of N.
If we look at the value of the limiting force of friction. So, the limiting force of friction is given by:
\[\begin{align}
& {{f}_{L}}=\mu N \\
& {{f}_{L}}=\mu (mg\cos \theta ) \\
& where,\ \mu <1 \\
\end{align}\]
The limiting force of friction will show the same characteristics as that of N but the magnitude of limiting friction will be less than that of N.
So here we can say that plot (2) and (3) are or Normal reaction and limiting force respectively.
When we take applied force into account the force shows its impact on the body after overcoming a certain value of frictional force which is static friction. And the force continues to increase. Thus, plot (1) represents the applied force on the body.
Now, we can conclude that the correct option which shows the plots representation correctly is Option C. That is (1) shows applied force, (2) normal reaction, and (3) represents the plot of limiting frictional force.
Note: Free body diagram of an object helps us to understand the forces applied to the body which are responsible for the object's balanced condition. For the particular case, the object is on an inclined plane so we have to look for the Cartesian components of the downward force mg. The cos component of the force mg plays an important role in balancing the normal reaction.
Complete step-by-step answer:
When an object is placed on an inclined plane the forces faced by the object are given by the free body diagram
From the figure we can say that:
The force normal to the object is equivalent to the cos component of the downward force mg. mathematically,
$N=mg\cos \theta $
The value of $\cos \theta $decreases with the increase in the value of$\theta $.
So we can say that N is inversely proportional to $\theta $
$N\propto \dfrac{1}{\theta }$
So the plot (2) or (3) will be the plotting of N.
If we look at the value of the limiting force of friction. So, the limiting force of friction is given by:
\[\begin{align}
& {{f}_{L}}=\mu N \\
& {{f}_{L}}=\mu (mg\cos \theta ) \\
& where,\ \mu <1 \\
\end{align}\]
The limiting force of friction will show the same characteristics as that of N but the magnitude of limiting friction will be less than that of N.
So here we can say that plot (2) and (3) are or Normal reaction and limiting force respectively.
When we take applied force into account the force shows its impact on the body after overcoming a certain value of frictional force which is static friction. And the force continues to increase. Thus, plot (1) represents the applied force on the body.
Now, we can conclude that the correct option which shows the plots representation correctly is Option C. That is (1) shows applied force, (2) normal reaction, and (3) represents the plot of limiting frictional force.
Note: Free body diagram of an object helps us to understand the forces applied to the body which are responsible for the object's balanced condition. For the particular case, the object is on an inclined plane so we have to look for the Cartesian components of the downward force mg. The cos component of the force mg plays an important role in balancing the normal reaction.
Recently Updated Pages
Master Class 11 English: Engaging Questions & Answers for Success
Master Class 11 Social Science: Engaging Questions & Answers for Success
Master Class 11 Maths: Engaging Questions & Answers for Success
Master Class 11 Biology: Engaging Questions & Answers for Success
Master Class 11 Physics: Engaging Questions & Answers for Success
Master Class 11 Chemistry: Engaging Questions & Answers for Success
Trending doubts
One Metric ton is equal to kg A 10000 B 1000 C 100 class 11 physics CBSE
Difference Between Prokaryotic Cells and Eukaryotic Cells
Find the value of the expression given below sin 30circ class 11 maths CBSE
Difference between physical and chemical change class 11 chemistry CBSE
Two of the body parts which do not appear in MRI are class 11 biology CBSE
Draw a diagram of a plant cell and label at least eight class 11 biology CBSE