


Which one of the following graphs best describe the blood pressure (BP) change when blood moves from the aorta to capillaries?
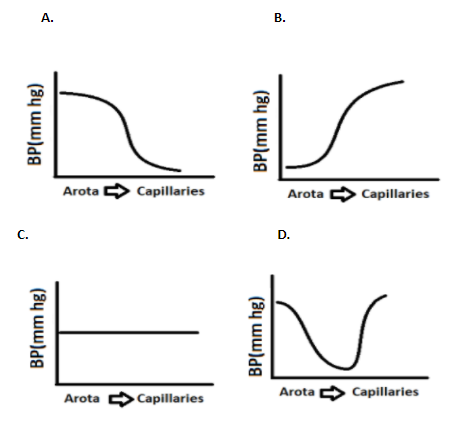
A) A
B) B
C) C
D) D
Answer
514.8k+ views
Hint: When blood flows through a blood vessel, it exerts a force on the vessel's walls. The blood pressure is measured with a sphygmomanometer, which reads the pressure at the aorta during systole (contraction of the ventricle) and diastole (relaxation of the ventricle).
Complete answer:
The diameter of the blood vessel is inversely related to the change in blood pressure. Blood is less likely to contact the vessel wall in a blood vessel with a big diameter. As a result, there is less friction and resistance. As a result, there is an increase in inflow. More blood contacts the vessel wall in a blood vessel with a narrow diameter. As a result, there is higher resistance to friction.
As a result, there is a decrease in the flow. The aorta's blood pressure is significantly higher than that of the capillaries. This is because, while each individual capillary's diameter is smaller than the aorta, the diameter of a group of capillaries is much larger than the aorta's diameter. As a result, blood pressure in capillaries is lower than in the aorta.
Therefore the correct answer is option 'A’.
Note: Blood pressure differs depending on the type of blood vessel. Because major arteries (such as the aorta) are directly attached to the heart's ventricle, blood pressure is highest there. Blood pressure drops as the blood artery separates from the tiny arteries and into the arterioles. This decrease happens because the surface area to volume ratio has increased, implying that the blood is in contact with greater blood vessel surface area. This lowers the pressure by slowing the velocity of blood within arterioles.
Recently Updated Pages
Basicity of sulphurous acid and sulphuric acid are
Master Class 11 Business Studies: Engaging Questions & Answers for Success
Master Class 11 Computer Science: Engaging Questions & Answers for Success
Master Class 11 Economics: Engaging Questions & Answers for Success
Master Class 11 Social Science: Engaging Questions & Answers for Success
Master Class 11 English: Engaging Questions & Answers for Success
Trending doubts
One Metric ton is equal to kg A 10000 B 1000 C 100 class 11 physics CBSE
The largest wind power cluster is located in the state class 11 social science CBSE
Explain zero factorial class 11 maths CBSE
State and prove Bernoullis theorem class 11 physics CBSE
Which among the following are examples of coming together class 11 social science CBSE
Can anyone list 10 advantages and disadvantages of friction