


Which of the following is the graph of a cubic function?
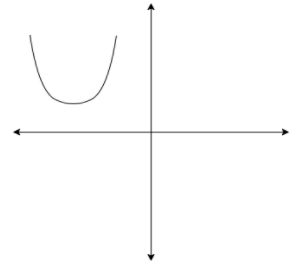
A.
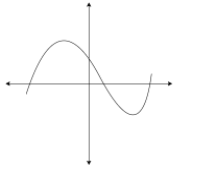
B.
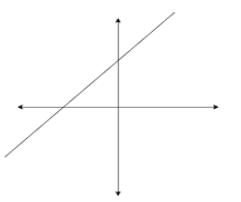
C.
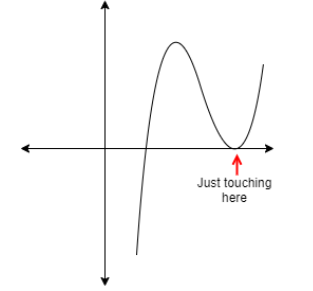
D.
Answer
599.4k+ views
Hint: To find the correct solution of this problem assume a simple cubic function $y = {x^3}$, now draw a graph using this equation. The obtained graph will match with the correct solution to the question.
Complete step-by-step solution -
Let us take a simple cubic function $y = {x^3}$ to plot the graph.
First let x =1
then Y=1
When x=2
then Y= ${2^3}$
Y = 8
Similarly, when x=3
Y=${3^3}$
Y=27
Do this procedure and make a table to record the data
Similarly repeat the process with negative numbers i.e.
when x= -1
Y=-1
When x=-2
x=-8
When x= -3
Y=-27
By continuing we get
Now use the data above from table 1 and table 2 to plot a graph which would look like this
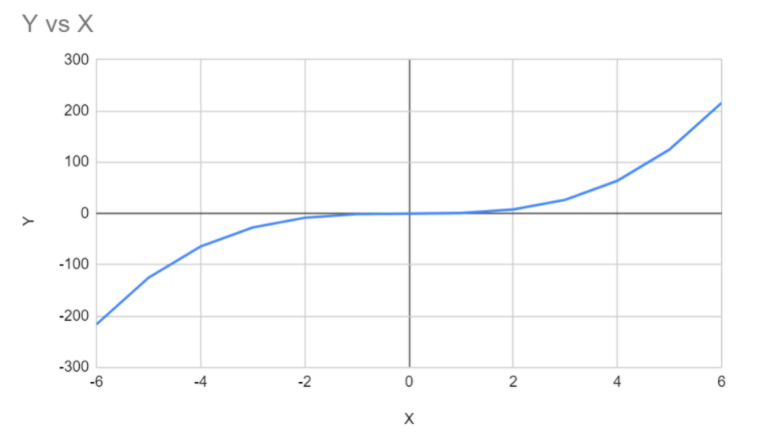
This graph can change since a cubic function is of the form $Y = a{x^3} + b{x^2} + cx + d$ as the variables are added the more complex the graph can be but as you can see the graph is similar to that of Option B and Option D. Thus, Option B and D are graphs of cubic Function. You can also determine this simply by analyzing the graph and using elimination methods.
In Graph A, there is no solution to the problem since the graph doesn’t intersect the x and Y axis.
Similarly in Graph C the graph is a straight line and we know that straight lines always have linear equations.
Note: In the above solution we used the concept of graph which can be explained as a common method of visually explaining relationships in data. The aim of a graph is to present data that are too numerous or complicated to be adequately represented in text and in less space.
Complete step-by-step solution -
Let us take a simple cubic function $y = {x^3}$ to plot the graph.
First let x =1
then Y=1
When x=2
then Y= ${2^3}$
Y = 8
Similarly, when x=3
Y=${3^3}$
Y=27
Do this procedure and make a table to record the data
| X | 1 | 2 | 3 | 4 | 5 | 6 |
| Y | 1 | 8 | 27 | 64 | 125 | 216 |
Similarly repeat the process with negative numbers i.e.
when x= -1
Y=-1
When x=-2
x=-8
When x= -3
Y=-27
By continuing we get
| X | 0 | -1 | -2 | -3 | -4 | -5 | -6 |
| Y | 0 | -1 | -8 | -27 | -64 | -125 | -216 |
Now use the data above from table 1 and table 2 to plot a graph which would look like this
This graph can change since a cubic function is of the form $Y = a{x^3} + b{x^2} + cx + d$ as the variables are added the more complex the graph can be but as you can see the graph is similar to that of Option B and Option D. Thus, Option B and D are graphs of cubic Function. You can also determine this simply by analyzing the graph and using elimination methods.
In Graph A, there is no solution to the problem since the graph doesn’t intersect the x and Y axis.
Similarly in Graph C the graph is a straight line and we know that straight lines always have linear equations.
Note: In the above solution we used the concept of graph which can be explained as a common method of visually explaining relationships in data. The aim of a graph is to present data that are too numerous or complicated to be adequately represented in text and in less space.
Recently Updated Pages
Master Class 10 Computer Science: Engaging Questions & Answers for Success
Master Class 10 General Knowledge: Engaging Questions & Answers for Success
Master Class 10 English: Engaging Questions & Answers for Success
Master Class 10 Social Science: Engaging Questions & Answers for Success
Master Class 10 Maths: Engaging Questions & Answers for Success
Master Class 10 Science: Engaging Questions & Answers for Success
Trending doubts
What is the median of the first 10 natural numbers class 10 maths CBSE
Which women's tennis player has 24 Grand Slam singles titles?
Who is the Brand Ambassador of Incredible India?
Why is there a time difference of about 5 hours between class 10 social science CBSE
Write a letter to the principal requesting him to grant class 10 english CBSE
State and prove converse of BPT Basic Proportionality class 10 maths CBSE