


Which of the following graphs can possibly represent one-dimensional motion of a particle?
A.
B.
C.
D.
Answer
573k+ views
Hint: The slope of a graph is the increase in the vertical axis with an increase in the horizontal axis (time). We need to check each of the graphs for reasonableness.
Complete answer: A set of given graphs were drawn and we’re to identify which of the following represents the graph of the motion of a particle in a single dimension. To determine which of the following can act as the motion of a particle in one dimension, we need to investigate the graph with known knowledge of how the quantities are given vary or generally behave.
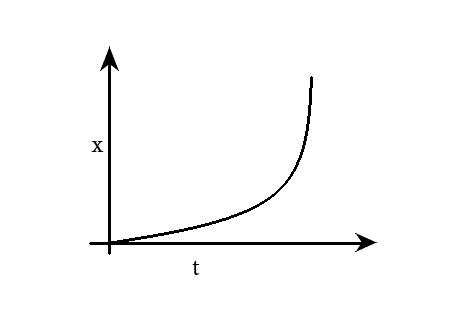
For option A, we see a graph of distance or displacement against time. The distance increases gradually with time, but at a point gradually steps to a higher slope. By the slope of the graph, this simply means a changed velocity at that point. Hence, option A is possible.
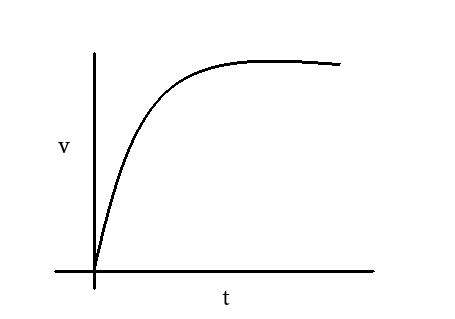
For option B, here we see a graph of velocity against time. The distance increases about linearly with time, but at a point, the rate decreases gradually and then continues at a constant velocity. This is also simply a situation where acceleration exists at first, then reduces to zero.
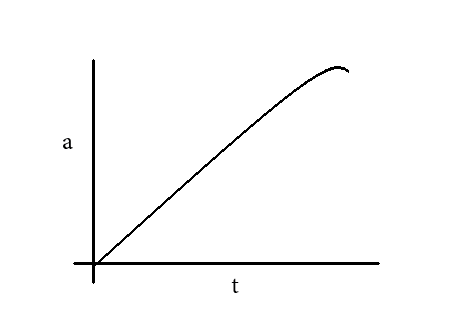
For option C, this is a graph of acceleration with time. The acceleration increases constantly (more or less) with time. This is also possible.
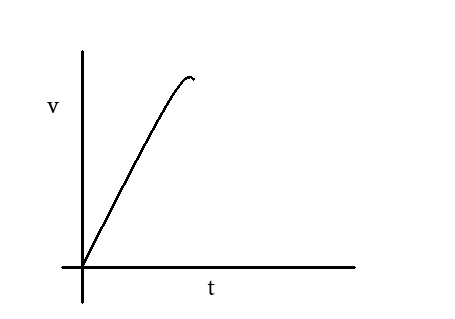
For option D, that’s another graph of velocity against time. Just like the one in option B it is can describe a motion in one dimension.
Hence, option A, B, C, D are all correct
Note: For acceleration and time graph, although it is not very relevant and common in kinematics, it is very possible for the acceleration of a body to constantly increase or decrease. This happens if the force exerted on a body is changing with respect to time. The rate of change of acceleration is called jerk.
Complete answer: A set of given graphs were drawn and we’re to identify which of the following represents the graph of the motion of a particle in a single dimension. To determine which of the following can act as the motion of a particle in one dimension, we need to investigate the graph with known knowledge of how the quantities are given vary or generally behave.
For option A, we see a graph of distance or displacement against time. The distance increases gradually with time, but at a point gradually steps to a higher slope. By the slope of the graph, this simply means a changed velocity at that point. Hence, option A is possible.
For option B, here we see a graph of velocity against time. The distance increases about linearly with time, but at a point, the rate decreases gradually and then continues at a constant velocity. This is also simply a situation where acceleration exists at first, then reduces to zero.
For option C, this is a graph of acceleration with time. The acceleration increases constantly (more or less) with time. This is also possible.
For option D, that’s another graph of velocity against time. Just like the one in option B it is can describe a motion in one dimension.
Hence, option A, B, C, D are all correct
Note: For acceleration and time graph, although it is not very relevant and common in kinematics, it is very possible for the acceleration of a body to constantly increase or decrease. This happens if the force exerted on a body is changing with respect to time. The rate of change of acceleration is called jerk.
Recently Updated Pages
Basicity of sulphurous acid and sulphuric acid are
Master Class 11 Business Studies: Engaging Questions & Answers for Success
Master Class 11 Computer Science: Engaging Questions & Answers for Success
Master Class 11 Economics: Engaging Questions & Answers for Success
Master Class 11 Social Science: Engaging Questions & Answers for Success
Master Class 11 English: Engaging Questions & Answers for Success
Trending doubts
Draw a diagram of nephron and explain its structur class 11 biology CBSE
Explain zero factorial class 11 maths CBSE
Chemical formula of Bleaching powder is A Ca2OCl2 B class 11 chemistry CBSE
Name the part of the brain responsible for the precision class 11 biology CBSE
The growth of tendril in pea plants is due to AEffect class 11 biology CBSE
One Metric ton is equal to kg A 10000 B 1000 C 100 class 11 physics CBSE