


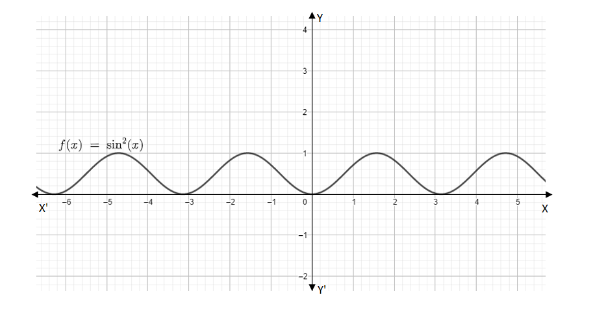
What is the graph of \[y = {\sin ^2}x\] ?
Answer
552.9k+ views
Hint: Here in this question, we have to plot the graph of a given trigonometric function. To solve this better we have to find the amplitude and period. Firstly, rewrite the given trigonometric function in the form of \[a\cos \left( {bx - c} \right) + d\] using the double angle formula, to Find the amplitude = \[\left| a \right|\] , then Find the period using the formula \[\dfrac{{2\pi }}{{\left| b \right|}}\] , \[\dfrac{c}{b}\] represent the phase shift and \[d\] represent the vertical shift, using all these we can plot the required graph.
Complete step by step solution:
Consider the given trigonometric function:
\[ \Rightarrow \,\,y = {\sin ^2}x\] -------(1)
As we know the double angle formula for cosine: \[\cos \left( {2x} \right) = 1 - 2{\sin ^2}\left( x \right)\]
It can be rewritten as:
\[ \Rightarrow \,\,\cos \left( {2x} \right) - 1 = - 2{\sin ^2}\left( x \right)\]
Divide both side by -2
\[ \Rightarrow \,\,{\sin ^2}\left( x \right) = \dfrac{{ - \cos \left( {2x} \right)}}{2} + \dfrac{1}{2}\]
\[ \Rightarrow \,\,{\sin ^2}\left( x \right) = - \dfrac{1}{2}\cos \left( {2x} \right) + \dfrac{1}{2}\]
The equation (1), becomes
\[ \Rightarrow \,\,y = - \dfrac{1}{2}\cos \left( {2x} \right) + \dfrac{1}{2}\]
Let the above equation be similar to the form of equation i.e., \[a\cos \left( {bx - c} \right) + d\] to find the variables used to find the amplitude, and period.
Now consider the given expression \[y = - \dfrac{1}{2}\cos \left( {2x} \right) + \dfrac{1}{2}\]
Where,
\[a = - \dfrac{1}{2}\]
\[b = 2\]
\[c = 0\]
\[d = \dfrac{1}{2}\]
The Amplitude is the height from the centre line to the peak (or to the trough). Or we can measure the height from highest to lowest points and divide that by 2.
To Find the amplitude = \[\left| a \right|\] .
\[ \Rightarrow \,\,\] Amplitude \[ = \left| a \right| = \left| { - \dfrac{1}{2}} \right| = \dfrac{1}{2}\] .
Then in the graph
Phase shift \[\dfrac{c}{b} = 0\] .
Vertical shift up by \[d = \dfrac{1}{2}\] .
Period is the complete revolution of a wave completing crest and followed by trough
Otherwise
The Period goes from one peak to the next (or from any point to the next matching point):
Find the period using the formula \[\dfrac{{2\pi }}{{\left| b \right|}}\]
\[ \Rightarrow \,\,\] Period \[ = \dfrac{{2\pi }}{{\left| 2 \right|}} = \dfrac{{2\pi }}{{\left| 2 \right|}} = \dfrac{{2\pi }}{2}\, = \pi \] .
The sketch of the given function \[y = {\sin ^2}x\] is:
Note: The period is the length of the smallest interval that contains exactly one copy of the repeating pattern. The Amplitude is the height from the centre line to the peak. We use the form of equation i.e., \[a\cos \left( {bx - c} \right) + d\] and we have formula for the period and amplitude and hence we determine the values.
Recently Updated Pages
Master Class 11 Social Science: Engaging Questions & Answers for Success
Master Class 11 English: Engaging Questions & Answers for Success
Master Class 11 Maths: Engaging Questions & Answers for Success
Master Class 11 Chemistry: Engaging Questions & Answers for Success
Master Class 11 Biology: Engaging Questions & Answers for Success
Master Class 11 Physics: Engaging Questions & Answers for Success
Trending doubts
Differentiate between an exothermic and an endothermic class 11 chemistry CBSE
One Metric ton is equal to kg A 10000 B 1000 C 100 class 11 physics CBSE
Difference Between Prokaryotic Cells and Eukaryotic Cells
There are 720 permutations of the digits 1 2 3 4 5 class 11 maths CBSE
Two of the body parts which do not appear in MRI are class 11 biology CBSE
Which gas is abundant in air class 11 chemistry CBSE