


Using the following data, draw a time-displacement graph for a moving object.
Time(S) \[0\] \[2\] \[4\] \[6\] \[8\] \[10\] \[12\] \[14\] \[16\] Displacement(m) \[0\] \[2\] \[4\] \[4\] \[4\] \[6\] \[4\] \[2\] \[0\]
Use the graph to find average velocity for first \[4\] s, for next \[4\] s and for last \[6\] s?
| Time(S) | \[0\] | \[2\] | \[4\] | \[6\] | \[8\] | \[10\] | \[12\] | \[14\] | \[16\] |
| Displacement(m) | \[0\] | \[2\] | \[4\] | \[4\] | \[4\] | \[6\] | \[4\] | \[2\] | \[0\] |
Answer
595.8k+ views
Hint: We will draw time and displacement graph and then we will plot the above values in the graph to find the movement of the object.
Formula Used:
Average velocity of an object is total distance covered by the object divided by total time taken by the object.
\[{\text{Average velocity = }}\dfrac{{{\text{Total distance}}}}{{{\text{Total time}}}}\]
Complete step by step answer:
In the first \[4\] sec, the object took a time of total \[4\]sec and the object covered only \[4\]metre.
Similarly, for the next \[4\] sec the total time will be considered as \[4\]sec but it has the same displacement of \[4\]meter.
But for the last \[6\]sec the total time taken will be \[6\]sec also but the displacement would be the slope of the graph moved from the two points.
So, we can draw the following graph to implement time and displacement:
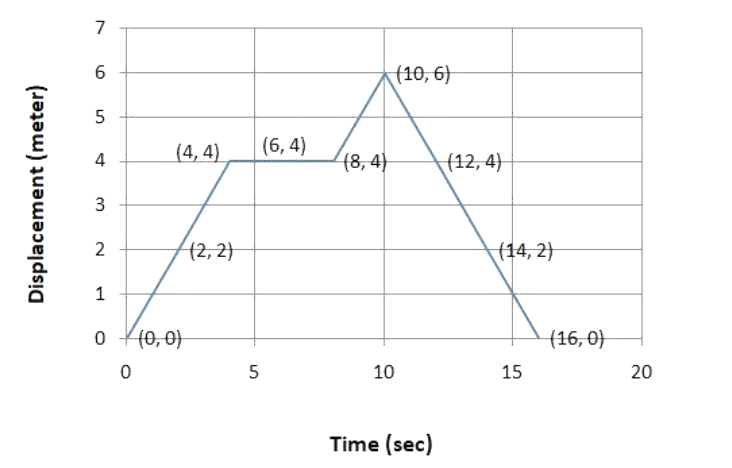
So, it is clearly seen in the above graph that for first \[0\]sec the object has no movement, but after another \[4\] sec the slope of the graph has been increased as the movement of the object has been increased accordingly.
But the object moved in the same horizontal zone as it moved the same distance from \[4\] sec to \[8\] sec, thus the slope of the graph became zero.
But, if we look closely in the graph, the slope of the graph is downgraded as the object moves from \[10\] sec to \[16\] sec, but there we can see the change in slope in the graph.
So, average velocity for the first \[4\] sec will be the total distance covered in the first \[4\] sec divided by total time taken.
So,
\[{\text{Velocit}}{{\text{y}}_{{\text{first 4sec}}}}{\text{ = }}\dfrac{{{\text{(4 - 0)}}}}{{{\text{(4 - 0)}}}}{\text{ = }}\dfrac{{\text{4}}}{{\text{4}}}{\text{ = 1}}\]\[m/\sec \]
For next \[4\]sec the velocity of the object will be the movement of the object in those \[4\] sec divided by the total time taken.
\[{\text{Velocit}}{{\text{y}}_{{\text{4s to 8s}}}}{\text{ = }}\dfrac{{{\text{(4 - 4)}}}}{{{\text{(8 - 4)}}}}{\text{ = }}\dfrac{{\text{0}}}{{\text{4}}}{\text{ = 0}}\]\[m/\sec \].
For the last \[6\]sec the movement of the object will be:
\[{\text{Velocit}}{{\text{y}}_{{\text{10s to 16s}}}}{\text{ = }}\dfrac{{{\text{(6 - 0)}}}}{{{\text{(16 - 10)}}}}{\text{ = }}\dfrac{{\text{6}}}{{\text{6}}}{\text{ = 1}}\]\[m/\sec \].
\[\therefore \]The required average velocities will be\[1m/\sec \],\[0m/\sec \] and \[1m/\sec \].
Note: From a particle’s movement in a velocity-time graph, its average velocity shall be count under the two different components:
Distance covered by the particle from a particular time slot and total time taken in that slot.
Formula Used:
Average velocity of an object is total distance covered by the object divided by total time taken by the object.
\[{\text{Average velocity = }}\dfrac{{{\text{Total distance}}}}{{{\text{Total time}}}}\]
Complete step by step answer:
In the first \[4\] sec, the object took a time of total \[4\]sec and the object covered only \[4\]metre.
Similarly, for the next \[4\] sec the total time will be considered as \[4\]sec but it has the same displacement of \[4\]meter.
But for the last \[6\]sec the total time taken will be \[6\]sec also but the displacement would be the slope of the graph moved from the two points.
So, we can draw the following graph to implement time and displacement:
So, it is clearly seen in the above graph that for first \[0\]sec the object has no movement, but after another \[4\] sec the slope of the graph has been increased as the movement of the object has been increased accordingly.
But the object moved in the same horizontal zone as it moved the same distance from \[4\] sec to \[8\] sec, thus the slope of the graph became zero.
But, if we look closely in the graph, the slope of the graph is downgraded as the object moves from \[10\] sec to \[16\] sec, but there we can see the change in slope in the graph.
So, average velocity for the first \[4\] sec will be the total distance covered in the first \[4\] sec divided by total time taken.
So,
\[{\text{Velocit}}{{\text{y}}_{{\text{first 4sec}}}}{\text{ = }}\dfrac{{{\text{(4 - 0)}}}}{{{\text{(4 - 0)}}}}{\text{ = }}\dfrac{{\text{4}}}{{\text{4}}}{\text{ = 1}}\]\[m/\sec \]
For next \[4\]sec the velocity of the object will be the movement of the object in those \[4\] sec divided by the total time taken.
\[{\text{Velocit}}{{\text{y}}_{{\text{4s to 8s}}}}{\text{ = }}\dfrac{{{\text{(4 - 4)}}}}{{{\text{(8 - 4)}}}}{\text{ = }}\dfrac{{\text{0}}}{{\text{4}}}{\text{ = 0}}\]\[m/\sec \].
For the last \[6\]sec the movement of the object will be:
\[{\text{Velocit}}{{\text{y}}_{{\text{10s to 16s}}}}{\text{ = }}\dfrac{{{\text{(6 - 0)}}}}{{{\text{(16 - 10)}}}}{\text{ = }}\dfrac{{\text{6}}}{{\text{6}}}{\text{ = 1}}\]\[m/\sec \].
\[\therefore \]The required average velocities will be\[1m/\sec \],\[0m/\sec \] and \[1m/\sec \].
Note: From a particle’s movement in a velocity-time graph, its average velocity shall be count under the two different components:
Distance covered by the particle from a particular time slot and total time taken in that slot.
Recently Updated Pages
Master Class 11 English: Engaging Questions & Answers for Success
Master Class 11 Social Science: Engaging Questions & Answers for Success
Master Class 11 Maths: Engaging Questions & Answers for Success
Master Class 11 Chemistry: Engaging Questions & Answers for Success
Master Class 11 Biology: Engaging Questions & Answers for Success
Master Class 11 Physics: Engaging Questions & Answers for Success
Trending doubts
One Metric ton is equal to kg A 10000 B 1000 C 100 class 11 physics CBSE
Difference Between Prokaryotic Cells and Eukaryotic Cells
Find the value of the expression given below sin 30circ class 11 maths CBSE
1 ton equals to A 100 kg B 1000 kg C 10 kg D 10000 class 11 physics CBSE
Two of the body parts which do not appear in MRI are class 11 biology CBSE
Draw a diagram of nephron and explain its structur class 11 biology CBSE