


How do you use a graph to solve an equation on the interval?
Answer
516k+ views
Hint: The given question is asked how we solve an equation by using a graph on the given interval. This question is asking the general format for solving an equation with the help of a graph. So let us explain the step by process to solve an equation on the interval only by using a graph and also with an example.
Complete step-by-step answer:
To solve an equation by using a graph on the given interval follow the steps given below:
Step 1: For a given equation on interval find the function \[y\] corresponding to the equation.
Step 2: Draw the table for different values of \[x\].
Step 3: Graph the function \[y\], for the values on the table above.
Step 4: Observe the graph and note the points for the given equation. Those points are the solution for the given equation.
Let us consider an equation \[\tan (x) = 1\] on an interval \[[ - 2\pi ,2\pi ]\].
Step 1: Find the function \[y\],
Given that \[\tan (x) = 1\], then the function \[y = \tan (x) - 1\].
Step 2: Draw the table for different values of \[x\].
On the given interval assign the different values for \[x\] and thus find \[y = \tan (x) - 1\].
Given interval \[[ - 2\pi ,2\pi ]\], the values between these interval are: \[ - 2\pi ,\dfrac{{ - 5\pi }}{4},\dfrac{{3\pi }}{4}\] and \[2\pi \].
Now, \[x = - 2\pi \Rightarrow y = \tan ( - 2\pi ) - 1\]
\[\tan ( - 2\pi ) = 0\], by substituting this value,
\[y = 0 - 1\]
\[y = - 1\]
\[x = \dfrac{{ - 5\pi }}{4} \Rightarrow y = \tan \left( {\dfrac{{ - 5\pi }}{4}} \right) - 1\]
Substituting the value \[\tan \left( {\dfrac{{ - 5\pi }}{4}} \right) = - 1\],
\[y = - 1 - 1\]
\[y = - 2\].
\[x = \dfrac{{3\pi }}{4} \Rightarrow y = \tan \left( {\dfrac{{3\pi }}{4}} \right) - 1\]
We know that \[\tan \left( {\dfrac{{3\pi }}{4}} \right) = - 1\],
\[y = - 1 - 1\]
\[y = - 2\].
\[x = 2\pi \Rightarrow y = \tan (2\pi ) - 1\]
Substitute \[\tan (2\pi ) = 0\],
\[y = 0 - 1\]
\[y = - 1\]
Now draw the table for the values we found.
Step 3: Graph the function \[y = \tan (x) - 1\]
Draw the coordinate plane and plot the points we found for the table and connect the points.
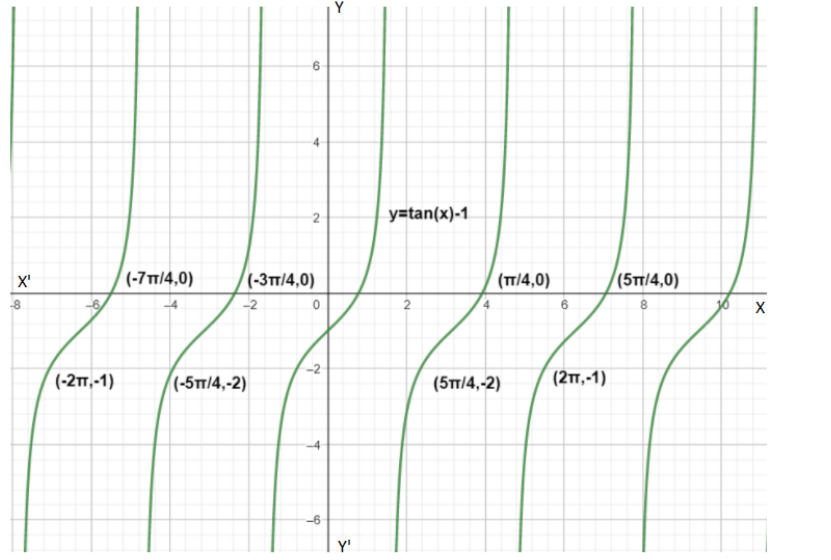
Step 4: Now, observe the graph, the solutions for \[\tan (x) = 1\] on interval \[[ - 2\pi ,2\pi ]\] are \[\left( {\dfrac{{ - 7\pi }}{4},\dfrac{{ - 3\pi }}{4},\dfrac{\pi }{4}\dfrac{{5\pi }}{4}} \right)\].
Hence we got the solution of \[\tan (x) = 1\] on an interval \[[ - 2\pi ,2\pi ]\] by using a graph.
Note: To plot a graph it is necessary to have both \[x\] value and \[y\] value to mark on \[x\]-axis and \[y\]- axis. Therefore convert the equation into function to obtain two points. And also be very careful while converting the equation into function. And then note the points in a form of table to identify them easily. The equation can also be solved manually by using a set of equations and formulas.
Complete step-by-step answer:
To solve an equation by using a graph on the given interval follow the steps given below:
Step 1: For a given equation on interval find the function \[y\] corresponding to the equation.
Step 2: Draw the table for different values of \[x\].
Step 3: Graph the function \[y\], for the values on the table above.
Step 4: Observe the graph and note the points for the given equation. Those points are the solution for the given equation.
Let us consider an equation \[\tan (x) = 1\] on an interval \[[ - 2\pi ,2\pi ]\].
Step 1: Find the function \[y\],
Given that \[\tan (x) = 1\], then the function \[y = \tan (x) - 1\].
Step 2: Draw the table for different values of \[x\].
On the given interval assign the different values for \[x\] and thus find \[y = \tan (x) - 1\].
Given interval \[[ - 2\pi ,2\pi ]\], the values between these interval are: \[ - 2\pi ,\dfrac{{ - 5\pi }}{4},\dfrac{{3\pi }}{4}\] and \[2\pi \].
Now, \[x = - 2\pi \Rightarrow y = \tan ( - 2\pi ) - 1\]
\[\tan ( - 2\pi ) = 0\], by substituting this value,
\[y = 0 - 1\]
\[y = - 1\]
\[x = \dfrac{{ - 5\pi }}{4} \Rightarrow y = \tan \left( {\dfrac{{ - 5\pi }}{4}} \right) - 1\]
Substituting the value \[\tan \left( {\dfrac{{ - 5\pi }}{4}} \right) = - 1\],
\[y = - 1 - 1\]
\[y = - 2\].
\[x = \dfrac{{3\pi }}{4} \Rightarrow y = \tan \left( {\dfrac{{3\pi }}{4}} \right) - 1\]
We know that \[\tan \left( {\dfrac{{3\pi }}{4}} \right) = - 1\],
\[y = - 1 - 1\]
\[y = - 2\].
\[x = 2\pi \Rightarrow y = \tan (2\pi ) - 1\]
Substitute \[\tan (2\pi ) = 0\],
\[y = 0 - 1\]
\[y = - 1\]
Now draw the table for the values we found.
| \[x\] | \[y = \tan (x) - 1\] | \[(x,y)\] |
| \[ - 2\pi \] | \[y = \tan ( - 2\pi ) - 1\] | \[( - 2\pi , - 1)\] |
| \[\dfrac{{ - 5\pi }}{4}\] | \[y = \tan \left( {\dfrac{{ - 5\pi }}{4}} \right) - 1\] | \[\left( {\dfrac{{ - 5\pi }}{4}, - 2} \right)\] |
| \[\dfrac{{3\pi }}{4}\] | \[y = \tan \left( {\dfrac{{3\pi }}{4}} \right) - 1\] | \[\left( {\dfrac{{3\pi }}{4}, - 2} \right)\] |
| \[2\pi \] | \[y = \tan (2\pi ) - 1\] | \[(2\pi , - 1)\] |
Step 3: Graph the function \[y = \tan (x) - 1\]
Draw the coordinate plane and plot the points we found for the table and connect the points.
Step 4: Now, observe the graph, the solutions for \[\tan (x) = 1\] on interval \[[ - 2\pi ,2\pi ]\] are \[\left( {\dfrac{{ - 7\pi }}{4},\dfrac{{ - 3\pi }}{4},\dfrac{\pi }{4}\dfrac{{5\pi }}{4}} \right)\].
Hence we got the solution of \[\tan (x) = 1\] on an interval \[[ - 2\pi ,2\pi ]\] by using a graph.
Note: To plot a graph it is necessary to have both \[x\] value and \[y\] value to mark on \[x\]-axis and \[y\]- axis. Therefore convert the equation into function to obtain two points. And also be very careful while converting the equation into function. And then note the points in a form of table to identify them easily. The equation can also be solved manually by using a set of equations and formulas.
Recently Updated Pages
Basicity of sulphurous acid and sulphuric acid are
Master Class 11 Business Studies: Engaging Questions & Answers for Success
Master Class 11 Computer Science: Engaging Questions & Answers for Success
Master Class 11 Economics: Engaging Questions & Answers for Success
Master Class 11 Social Science: Engaging Questions & Answers for Success
Master Class 11 English: Engaging Questions & Answers for Success
Trending doubts
One Metric ton is equal to kg A 10000 B 1000 C 100 class 11 physics CBSE
The largest wind power cluster is located in the state class 11 social science CBSE
Explain zero factorial class 11 maths CBSE
What steps did the French revolutionaries take to create class 11 social science CBSE
Which among the following are examples of coming together class 11 social science CBSE
Why was the Vernacular Press Act passed by British class 11 social science CBSE