


How do you translate a graph left or right?
Answer
544.2k+ views
Hint: In order to translate a graph left or right , use the definition of horizontal translation which states that horizontal translation for some function $ f\left( x \right) $ is a function $ g\left( x \right) $ which has a relation $ g\left( x \right) = f\left( {x - c} \right) $ . Here $ c $ determines the direction of shift as if x is positive then there will be right shift by $ c\, $ units and when $ c $ is negative , then left shift by $ c $ units.
Complete step-by-step answer:
As per the question we have to answer how we will translate a graph left or right.
So translating a graph left or right in mathematical terms is actually doing horizontal translation for any function $ f\left( x \right) $ .
Let’s understand what a horizontal translation means. So horizontal translation means shifting the base graph for some function $ f\left( x \right) $ in the left or right direction over the x-axis. Suppose a graph is translated $ c $ units , then all the points on the graph will move $ c $ units in the horizontal direction.
Let the base function be $ f\left( x \right) $ and $ c $ as the constant value , then by definition the resultant graph or function $ g\left( x \right) $ will be
$ g\left( x \right) = f\left( {x - c} \right) $
The value of constant $ c $ actually determine the direction of the shift, whether left or right as :
If $ c > 0 $ , the base graph shifts to the right direction by $ c $ units and
If $ c < 0 $ , the base graph shifts to the left direction by $ c $ units
Let's look an example for horizontal translation to get the better understanding :
Suppose we have a base function $ f\left( x \right) = 2{x^2} $ and we have to find the graph for $ g\left( x \right) = f\left( {x - 2} \right) $ .
As we know the graph of the quadratic equation is parabola , so the graph of $ f\left( x \right) $ is also parabola.
So , by substituting all the occurrences of $ x $ with $ x - 2 $ in the $ f\left( x \right) $ we have the function $ g\left( x \right) $ as
$ g\left( x \right) = 2{\left( {x - 2} \right)^2} $
As per the definition of horizontal translation, we have constant $ c = 2 $ , which is positive. Hence the graph of $ g\left( x \right) $ will look like $ f\left( x \right) $ but shifted 2 units right .
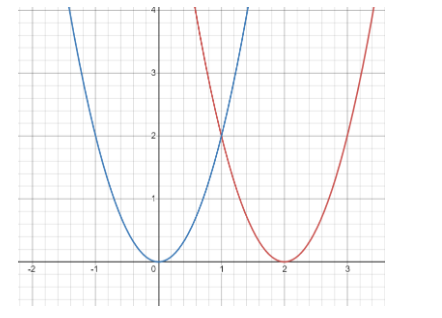
Blue coloured parabola depicts the graph of base function $ f\left( x \right) = 2{x^2} $ and
Red coloured parabola depicts the graph of $ g\left( x \right) = f\left( {x - 2} \right) = 2{\left( {x - 2} \right)^2} $
Note: 1.Draw the graph of functions on the cartesian plane only with the help of straight ruler and pencil to get the perfect and accurate results.
2.Mark the points carefully.
3. x-intercept is the point at which the graph intersects the x-axis of the plane and similarly y-intercept is the point at which graph intersects the y-axis of the plane.
4. Before solving problems related to graph translations, first check whether there is a vertical shift or horizontal shift. Horizontal shift is always have the form $ g\left( x \right) = f\left( {x - c} \right) $ and the vertical shift is in the form of $ g\left( x \right) = f\left( x \right) - c $ , where $ c $ is a constant value which determines units of shift.
5. Horizontal translation or Vertical translation , both do not affect the actual shape of any graph or function .
Complete step-by-step answer:
As per the question we have to answer how we will translate a graph left or right.
So translating a graph left or right in mathematical terms is actually doing horizontal translation for any function $ f\left( x \right) $ .
Let’s understand what a horizontal translation means. So horizontal translation means shifting the base graph for some function $ f\left( x \right) $ in the left or right direction over the x-axis. Suppose a graph is translated $ c $ units , then all the points on the graph will move $ c $ units in the horizontal direction.
Let the base function be $ f\left( x \right) $ and $ c $ as the constant value , then by definition the resultant graph or function $ g\left( x \right) $ will be
$ g\left( x \right) = f\left( {x - c} \right) $
The value of constant $ c $ actually determine the direction of the shift, whether left or right as :
If $ c > 0 $ , the base graph shifts to the right direction by $ c $ units and
If $ c < 0 $ , the base graph shifts to the left direction by $ c $ units
Let's look an example for horizontal translation to get the better understanding :
Suppose we have a base function $ f\left( x \right) = 2{x^2} $ and we have to find the graph for $ g\left( x \right) = f\left( {x - 2} \right) $ .
As we know the graph of the quadratic equation is parabola , so the graph of $ f\left( x \right) $ is also parabola.
So , by substituting all the occurrences of $ x $ with $ x - 2 $ in the $ f\left( x \right) $ we have the function $ g\left( x \right) $ as
$ g\left( x \right) = 2{\left( {x - 2} \right)^2} $
As per the definition of horizontal translation, we have constant $ c = 2 $ , which is positive. Hence the graph of $ g\left( x \right) $ will look like $ f\left( x \right) $ but shifted 2 units right .
Blue coloured parabola depicts the graph of base function $ f\left( x \right) = 2{x^2} $ and
Red coloured parabola depicts the graph of $ g\left( x \right) = f\left( {x - 2} \right) = 2{\left( {x - 2} \right)^2} $
Note: 1.Draw the graph of functions on the cartesian plane only with the help of straight ruler and pencil to get the perfect and accurate results.
2.Mark the points carefully.
3. x-intercept is the point at which the graph intersects the x-axis of the plane and similarly y-intercept is the point at which graph intersects the y-axis of the plane.
4. Before solving problems related to graph translations, first check whether there is a vertical shift or horizontal shift. Horizontal shift is always have the form $ g\left( x \right) = f\left( {x - c} \right) $ and the vertical shift is in the form of $ g\left( x \right) = f\left( x \right) - c $ , where $ c $ is a constant value which determines units of shift.
5. Horizontal translation or Vertical translation , both do not affect the actual shape of any graph or function .
Recently Updated Pages
Basicity of sulphurous acid and sulphuric acid are
Master Class 10 English: Engaging Questions & Answers for Success
Master Class 10 Social Science: Engaging Questions & Answers for Success
Master Class 10 Computer Science: Engaging Questions & Answers for Success
Class 10 Question and Answer - Your Ultimate Solutions Guide
Master Class 10 General Knowledge: Engaging Questions & Answers for Success
Trending doubts
Which country won the ICC Men's ODI World Cup in 2023?
In cricket, how many legal balls are there in a standard over?
Explain the Treaty of Vienna of 1815 class 10 social science CBSE
A boat goes 24 km upstream and 28 km downstream in class 10 maths CBSE
What does "powerplay" mean in limited-overs cricket?
What is the "Powerplay" in T20 cricket?