


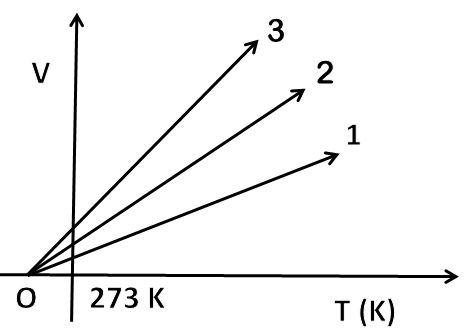
The volume-temperature graph of a given mass of an ideal gas at constant pressure is shown in the figure. Which graph (out of 1,2 or 3) will correspond to the highest pressure?
Answer
632.1k+ views
Hint: We know that the ideal gas equation is $\text{PV=nRT}$. When we deal with volume-temperature graphs, actually we are taking volume and temperature as variables taking other terms constant. This is what is called Charles' Law. Here, we have to take temperature in absolute values (in Kelvin) to obtain the required graph.
Complete step by step answer:
When the pressure of the gas molecules and amount of gas is taken as constant, the Kelvin temperature is directly proportional to the volume. It is found that each degree rise in temperature, volume of gas increases by $\dfrac{1}{273.15}$ of the original volume of gas at ${{0}^{\text{o}}}\text{C}$.
This relationship can be written as: ${{\text{V}}_{\text{t}}}={{\text{V}}_{\text{o}}}+\dfrac{\text{t}}{273.15}{{\text{V}}_{\text{o}}}$; where ${{\text{V}}_{\text{t}}}$ is the volume of gas at ${{\text{t}}^{\text{o}}}\text{C}$ and ${{\text{V}}_{\text{o}}}$ is the volume of gas at ${{0}^{\text{o}}}\text{C}$.
In absolute temperature or Kelvin temperature scale, ${{\text{T}}_{\text{t}}}\text{=273}\text{.15}+\text{t}$ and ${{\text{T}}_{\text{o}}}=273.15$. The relation is transformed to ${{\text{V}}_{\text{t}}}={{\text{V}}_{\text{o}}}\left( \dfrac{{{\text{T}}_{\text{t}}}}{{{\text{T}}_{\text{o}}}} \right)$ or $\dfrac{{{\text{V}}_{\text{t}}}}{{{\text{V}}_{\text{o}}}}=\dfrac{{{\text{T}}_{\text{t}}}}{{{\text{T}}_{\text{o}}}}$.
So, the general equation is $\dfrac{{{\text{V}}_{1}}}{{{\text{T}}_{1}}}=\dfrac{{{\text{V}}_{2}}}{{{\text{T}}_{2}}}$. It means $\dfrac{\text{V}}{\text{T}}=\text{constant}$, this constant value is pressure of gas and moles. According to ideal gas, the relation is $\text{V = }\dfrac{\text{nR}}{\text{P}}\times \text{T}$. The volume-temperature graph is a straight line with an intercept on the x-axis at $-273.15\text{ K}$. Slopes at different pressures are different. More is the slope of the line, less will be the pressure of gas as $\text{slope}\propto \dfrac{1}{\text{P}}$. Line 3 has the greatest slope, so it will correspond to least pressure. So, the correct answer is “Line 1”.
Note: As the pressure is constant, the graph is called an isobar. All the gases follow Charles’ law at very low pressures and high temperatures. At absolute temperature at $\text{T =0 K}$, the volume of gases is zero. It is because no gas tends to exist at that temperature. This is actually a hypothetical situation as gases liquefy before this temperature is reached.
Recently Updated Pages
Master Class 5 English: Engaging Questions & Answers for Success
Master Class 5 Maths: Engaging Questions & Answers for Success
Master Class 5 Social Science: Engaging Questions & Answers for Success
Master Class 5 Science: Engaging Questions & Answers for Success
Class 5 Question and Answer - Your Ultimate Solutions Guide
Master Class 9 General Knowledge: Engaging Questions & Answers for Success
Trending doubts
One Metric ton is equal to kg A 10000 B 1000 C 100 class 11 physics CBSE
What is cell theory Who formulated it class 11 biology CBSE
Phyllotaxy is the arrangement of ALeaflets BLeaves class 11 biology CBSE
Difference Between Prokaryotic Cells and Eukaryotic Cells
The symbiotic association of fungi and algae is called class 11 biology CBSE
Cell theory was formulated by A Schleiden and Schwann class 11 biology CBSE