


The graph shows the species-area relationship. Name the naturalist who studied two kinds of relationships shown in the graph. Write the observation made by him.
Answer
607.8k+ views
Hint: Species area relationship is also called species-area curve. Species area curve gives the relationship between the number of species found within that area and the part of habitat or the area of habitat. It was studied by a Prussian biologist.
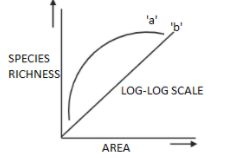
Complete answer: Alexander Von Humboldt, a Prussian naturalist studied two kinds of relationships in the species-area curve. He observed an increase in a large number of species with the increase in the area but up to a certain limit. This relationship is represented using a rectangular parabola which describes the equation $S=c{{Z}^{2}}$. The $S$ in the equation stands for species richness, $A$ stands for the area, $c$ represents a constant term, and $z$ stands for the slope of the species-area relationship in log-log space. The straight line in the species-area relationship graph represents the logarithmic form of equation $S=c{{A}^{z}}$ which is \[\log \left( S \right)=\log \left( c \right)+z\log \left( A \right)\]. Various factors such as the relative balance between the immigration and extinction, predator-prey dynamics, rate and magnitude of disturbance on small vs. large areas, and clustering of individuals of the same species as a result of habitat heterogeneity or dispersal limitation are used to determine the slope and elevation of the species-area relationship.
Note: According to the census design used to construct species-area relationships, the species-area relationship differed. Species relationship curve is related to the species discovery curve but not identical to it. It is believed that the species-area relationship follows the second law of thermodynamics.
Recently Updated Pages
Master Class 12 Business Studies: Engaging Questions & Answers for Success
Master Class 12 Chemistry: Engaging Questions & Answers for Success
Master Class 12 Biology: Engaging Questions & Answers for Success
Class 12 Question and Answer - Your Ultimate Solutions Guide
Master Class 11 English: Engaging Questions & Answers for Success
Master Class 11 Social Science: Engaging Questions & Answers for Success
Trending doubts
Which are the Top 10 Largest Countries of the World?
Draw a labelled sketch of the human eye class 12 physics CBSE
The end of compass needle which points towards north class 12 physics CBSE
Differentiate between homogeneous and heterogeneous class 12 chemistry CBSE
Why is the cell called the structural and functional class 12 biology CBSE
When was the first election held in India a 194748 class 12 sst CBSE