


The graph of the sine function lies exactly in which of the following region?
A) \[y = - 1{\text{ }}to{\text{ }}y = 1\]
B) \[y = - \infty {\text{ }}to{\text{ }}y = \infty {\text{ }}\]
C) \[y = 1{\text{ }}to{\text{ }}y = \infty {\text{ }}\]
D) \[y = - \infty {\text{ }}to{\text{ }}y = - 1\]
Answer
582.9k+ views
Hint: To find the region in which graph of sine function lies exactly we will draw a graph by plotting various sine angles. From there, the maximum and minimum values on the y – axis will be the region or range of the sine function.
Trigonometric formulas:
$ \sin \left( {90 + \theta } \right) = \cos \theta $
$ \sin \left( {180 + \theta } \right) = - \sin \theta $
Complete step by step solution:
The value of different angles of sine is given as:
sin 0° = 0
sin 90° = 1
sin 180° = sin (90 + 90°)
= cos 90° $ \left[ {\because \sin \left( {90 + \theta } \right) = \cos \theta } \right] $
= 0
sin 270° = sin (180 + 90°)
= sin 90° $ \left[ {\because \sin \left( {180 + \theta } \right) = - \sin \theta } \right] $
= -1
sin 360° = sin (180 + 180°)
= sin 180°
= 0
To get a graph for sine function we can plot the values of certain angles on the graph. The table for values of sine can be drawn as:
Plotting these values on graph we get:
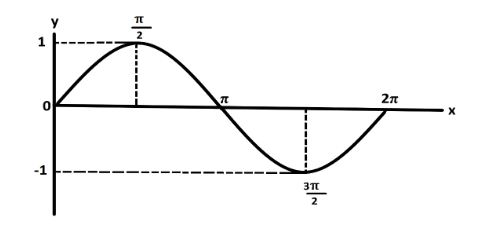
From the graph, it can be seen that the minimum value at y –axis is -1 and the maximum value is 1. So, the graph of sine function will lie between the range \[y = - 1{\text{ }}to{\text{ }}y = 1\].
So, the correct answer is “Option A”.
Note: We take the sine angle greater than 180° with a negative sign because the value does not lie in the second quadrant and the sine function is positive only in the second quadrant where values lie between 90° to 180° .
We know that the value of sine function lies between the interval -1 to 1 and represented as:
$ - 1 \leqslant \sin x \leqslant 1 $
So, we could have written the range along y- axis directly
Trigonometric formulas:
$ \sin \left( {90 + \theta } \right) = \cos \theta $
$ \sin \left( {180 + \theta } \right) = - \sin \theta $
Complete step by step solution:
The value of different angles of sine is given as:
sin 0° = 0
sin 90° = 1
sin 180° = sin (90 + 90°)
= cos 90° $ \left[ {\because \sin \left( {90 + \theta } \right) = \cos \theta } \right] $
= 0
sin 270° = sin (180 + 90°)
= sin 90° $ \left[ {\because \sin \left( {180 + \theta } \right) = - \sin \theta } \right] $
= -1
sin 360° = sin (180 + 180°)
= sin 180°
= 0
To get a graph for sine function we can plot the values of certain angles on the graph. The table for values of sine can be drawn as:
| Angles | Measure |
| sin 0° | 0 |
| sin 90° $ \to \left[ {\sin \left( {\dfrac{\pi }{2}} \right)} \right] $ | 1 |
| sin 180° $ \to \left[ {\sin \left( \pi \right)} \right] $ | 0 |
| sin 270° $ \to \left[ {\sin \left( {\dfrac{{3\pi }}{2}} \right)} \right] $ | -1 |
| sin 360° $ \to \left[ {\sin \left( {2\pi } \right)} \right] $ | 0 |
Plotting these values on graph we get:
From the graph, it can be seen that the minimum value at y –axis is -1 and the maximum value is 1. So, the graph of sine function will lie between the range \[y = - 1{\text{ }}to{\text{ }}y = 1\].
So, the correct answer is “Option A”.
Note: We take the sine angle greater than 180° with a negative sign because the value does not lie in the second quadrant and the sine function is positive only in the second quadrant where values lie between 90° to 180° .
We know that the value of sine function lies between the interval -1 to 1 and represented as:
$ - 1 \leqslant \sin x \leqslant 1 $
So, we could have written the range along y- axis directly
Recently Updated Pages
Basicity of sulphurous acid and sulphuric acid are
Master Class 11 Business Studies: Engaging Questions & Answers for Success
Master Class 11 Computer Science: Engaging Questions & Answers for Success
Master Class 11 Economics: Engaging Questions & Answers for Success
Master Class 11 Social Science: Engaging Questions & Answers for Success
Master Class 11 English: Engaging Questions & Answers for Success
Trending doubts
One Metric ton is equal to kg A 10000 B 1000 C 100 class 11 physics CBSE
The largest wind power cluster is located in the state class 11 social science CBSE
Explain zero factorial class 11 maths CBSE
State and prove Bernoullis theorem class 11 physics CBSE
What steps did the French revolutionaries take to create class 11 social science CBSE
Which among the following are examples of coming together class 11 social science CBSE