


The graph of the equation of the form y=mx is a line which always passes through-
A.$\left( {0,m} \right)$
B.$\left( {x,0} \right)$
C.$\left( {0,y} \right)$
D.$\left( {0,0} \right)$
Answer
608.4k+ views
Hint: -We have to find the point through which the general equation y=mx passes. Here m is the slope of the line. So, first we will draw the graph of the equation. We know that the graph of the linear equation is always a straight line. Here the equation is a linear equation so we will get the graph of a straight line. Then we will check the points through which the line passes by observing the graph.
Complete step-by-step answer:
We have to find the point through which the line of the equation of form y=mx passes.
It is already given that the graph of the equation of the form y=mx is a line.
So first we will draw the graph of the line y=mx where m represents the slope of the line.
Here the equation is a linear equation so the graph will also be a straight line.
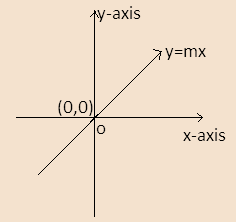
We can see from the graph that the equation of the line passes through point$\left( {0,0} \right)$.It means that the line of equation of the form y= mx passes through origin.
The correct answer is D.
Note: Here, every point on the straight line is the solution of the linear equation. When any such equation is given then we make the graph of the equation by following steps-
First, we put the value of x=$1,2,3,...$ in the equation so that we can find the value of y.
Then we mark the coordinates of the x and y on X-axis and Y-axis respectively.
Then join all the coordinates and you’ll get the graph.
Complete step-by-step answer:
We have to find the point through which the line of the equation of form y=mx passes.
It is already given that the graph of the equation of the form y=mx is a line.
So first we will draw the graph of the line y=mx where m represents the slope of the line.
Here the equation is a linear equation so the graph will also be a straight line.
We can see from the graph that the equation of the line passes through point$\left( {0,0} \right)$.It means that the line of equation of the form y= mx passes through origin.
The correct answer is D.
Note: Here, every point on the straight line is the solution of the linear equation. When any such equation is given then we make the graph of the equation by following steps-
First, we put the value of x=$1,2,3,...$ in the equation so that we can find the value of y.
Then we mark the coordinates of the x and y on X-axis and Y-axis respectively.
Then join all the coordinates and you’ll get the graph.
Recently Updated Pages
Master Class 11 Social Science: Engaging Questions & Answers for Success
Master Class 11 English: Engaging Questions & Answers for Success
Master Class 11 Maths: Engaging Questions & Answers for Success
Master Class 11 Chemistry: Engaging Questions & Answers for Success
Master Class 11 Biology: Engaging Questions & Answers for Success
Master Class 11 Physics: Engaging Questions & Answers for Success
Trending doubts
One Metric ton is equal to kg A 10000 B 1000 C 100 class 11 physics CBSE
Difference Between Prokaryotic Cells and Eukaryotic Cells
Draw a diagram of a plant cell and label at least eight class 11 biology CBSE
Two of the body parts which do not appear in MRI are class 11 biology CBSE
Which gas is abundant in air class 11 chemistry CBSE
10 examples of friction in our daily life