


The graph of a constant function F(x) = k is?
A. A straight line parallel to X -axis
B. A straight line parallel to Y-axis
C. A straight line passing through origin
D. None
Answer
612.3k+ views
Hint: As the question mentions that we have to draw the graph of a constant function and we know that a graph of constant function is always a horizontal line. First, we have to draw the graph of the horizontal line. A constant function is a function whose output is the same for every input.
Complete step-by-step answer:
As the question mention that the function f(x) = k is constant
So, the graph of constant function is always a horizontal line and the function is for X axis then the horizontal line is parallel to x axis.
Draw the graph in which first draw the x-axis and y-axis
Now draw a horizontal line which is parallel to x-axis.
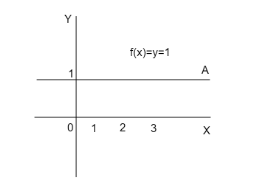
Line A is parallel to x-axis in the graph drawn above
Hence the option A (a straight line parallel to x-axis) is the correct answer.
Note: Here students get confused between the word constant. You should know a constant function in a graph is a function whose output or value is the same for every input that is why a graph of a constant function is always a straight line. If the function mentions X axis then in the graph a straight line is parallel to x axis and same as if the function mentions Y axis then the graph shows a straight line parallel to y axis.
Complete step-by-step answer:
As the question mention that the function f(x) = k is constant
So, the graph of constant function is always a horizontal line and the function is for X axis then the horizontal line is parallel to x axis.
Draw the graph in which first draw the x-axis and y-axis
Now draw a horizontal line which is parallel to x-axis.
Line A is parallel to x-axis in the graph drawn above
Hence the option A (a straight line parallel to x-axis) is the correct answer.
Note: Here students get confused between the word constant. You should know a constant function in a graph is a function whose output or value is the same for every input that is why a graph of a constant function is always a straight line. If the function mentions X axis then in the graph a straight line is parallel to x axis and same as if the function mentions Y axis then the graph shows a straight line parallel to y axis.
Recently Updated Pages
Master Class 10 Computer Science: Engaging Questions & Answers for Success
Master Class 10 General Knowledge: Engaging Questions & Answers for Success
Master Class 10 English: Engaging Questions & Answers for Success
Master Class 10 Social Science: Engaging Questions & Answers for Success
Master Class 10 Maths: Engaging Questions & Answers for Success
Master Class 10 Science: Engaging Questions & Answers for Success
Trending doubts
Explain the Treaty of Vienna of 1815 class 10 social science CBSE
Who Won 36 Oscar Awards? Record Holder Revealed
What is the median of the first 10 natural numbers class 10 maths CBSE
What is the name of Japan Parliament?
Why is it 530 pm in india when it is 1200 afternoon class 10 social science CBSE
Select the word that is correctly spelled a Twelveth class 10 english CBSE