


The graph between temperature and pressure of a perfect gas is
(A) hyperbola.
(B) parabola.
(C) a straight line parallel to the pressure axes at $ 73^\circ C $ .
(D) a straight line intercepting the temperature axes at $ 273^\circ C $ .
Answer
594k+ views
Hint: Since the temperature and pressure of an ideal gas are directly proportional to each other so as the temperature increases, so does the pressure of the gas. Therefore the graph will be a straight line and if the temperature is written in Kelvin then the intercept will be at $ 273^\circ C $ .
Complete step by step solution:
From the Gay-Lussac’s law, the temperature of an ideal gas is directly proportional to its pressure. As the temperature of an ideal gas increases, then the kinetic energy of the gas molecules also increases. With the increase in the kinetic energy, the particles start moving faster with greater speed as the mass of the particles is constant.
As the speed of the particles increase, they start hitting the walls of the container with greater force and momentum. So the force per collision of the particles increases on the walls. So the pressure also increases.
Therefore, with the increase in the temperature, the pressure increases proportionally. So the graph between the pressure and temperature will be a straight line. If the temperature is taken in Kelvin then the straight line passes through the origin.
But if the temperature is taken in Celsius, then the straight line intercepts the temperature axis at $ 273^\circ C $ . It can be seen as,
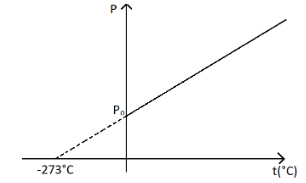
So the correct answer will be option D.
Note:
This can also be seen similarly from the ideal gas equation. The equation is given by,
$ PV = nRT $ . So when the volume of the container and the number of moles remain constant, we can see that the temperature varies as directly proportional to the pressure.
Complete step by step solution:
From the Gay-Lussac’s law, the temperature of an ideal gas is directly proportional to its pressure. As the temperature of an ideal gas increases, then the kinetic energy of the gas molecules also increases. With the increase in the kinetic energy, the particles start moving faster with greater speed as the mass of the particles is constant.
As the speed of the particles increase, they start hitting the walls of the container with greater force and momentum. So the force per collision of the particles increases on the walls. So the pressure also increases.
Therefore, with the increase in the temperature, the pressure increases proportionally. So the graph between the pressure and temperature will be a straight line. If the temperature is taken in Kelvin then the straight line passes through the origin.
But if the temperature is taken in Celsius, then the straight line intercepts the temperature axis at $ 273^\circ C $ . It can be seen as,
So the correct answer will be option D.
Note:
This can also be seen similarly from the ideal gas equation. The equation is given by,
$ PV = nRT $ . So when the volume of the container and the number of moles remain constant, we can see that the temperature varies as directly proportional to the pressure.
Recently Updated Pages
Master Class 11 Social Science: Engaging Questions & Answers for Success
Master Class 11 English: Engaging Questions & Answers for Success
Master Class 11 Maths: Engaging Questions & Answers for Success
Master Class 11 Chemistry: Engaging Questions & Answers for Success
Master Class 11 Biology: Engaging Questions & Answers for Success
Master Class 11 Physics: Engaging Questions & Answers for Success
Trending doubts
One Metric ton is equal to kg A 10000 B 1000 C 100 class 11 physics CBSE
Difference Between Prokaryotic Cells and Eukaryotic Cells
How many of the following diseases can be studied with class 11 biology CBSE
Which of the following enzymes is used for carboxylation class 11 biology CBSE
Draw a diagram of a plant cell and label at least eight class 11 biology CBSE
Two of the body parts which do not appear in MRI are class 11 biology CBSE