


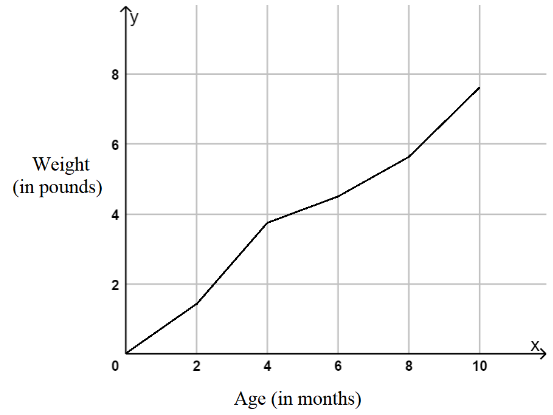
The given line graph shows the growth rate of a kitten. During which two month period the kitten weight increased the most?
A. $0$ to $2$ months
B. $2$ to $4$ months
C. $4$ to $6$ months
D. $6$ to $8$ months
Answer
543.9k+ views
Hint:The given questions revolve around the concepts of data handling tools such as line graph. A line graph is a way of representing a data set in the form of a graph using straight lines to indicate the value of a quantity. One must know how to read a line graph using the values of the quantities that are represented through the graph. Also, we should know how to check the change in quantities by judging the slope and inclination of the straight lines.
Complete step by step answer:
In the given question, we are provided with the line graph shown below.

We are required to find the two month period in which the weight of the kitten increased the most. We can get an idea about the change in the weight of the kitten by comparing the slopes and inclinations of the straight lines in the line graphs.Now, we see that the line graph shown is the steepest in the period of $2$ months to $4$ months.
So, this means that the slope of the line graph is the maximum in the period of $2$ months to $4$ months. Also, the slope is positive in the graph throughout. This means that the kitten's weight of kitten is increasing with time. Hence, the two month period in which the weight of the kitten increased the most is from $2$ months to $4$ months.
Hence, the correct answer is option B.
Note:One must know how to read line graphs correctly as the given questions tests the ability to do so. We also must be aware of the scale which is used in a line graph before solving such problems as it affects the final answer to a great extent. We must know the applications of derivatives and slope of a straight line to judge the change in the quantities in a line graph.
Complete step by step answer:
In the given question, we are provided with the line graph shown below.
We are required to find the two month period in which the weight of the kitten increased the most. We can get an idea about the change in the weight of the kitten by comparing the slopes and inclinations of the straight lines in the line graphs.Now, we see that the line graph shown is the steepest in the period of $2$ months to $4$ months.
So, this means that the slope of the line graph is the maximum in the period of $2$ months to $4$ months. Also, the slope is positive in the graph throughout. This means that the kitten's weight of kitten is increasing with time. Hence, the two month period in which the weight of the kitten increased the most is from $2$ months to $4$ months.
Hence, the correct answer is option B.
Note:One must know how to read line graphs correctly as the given questions tests the ability to do so. We also must be aware of the scale which is used in a line graph before solving such problems as it affects the final answer to a great extent. We must know the applications of derivatives and slope of a straight line to judge the change in the quantities in a line graph.
Recently Updated Pages
Master Class 12 Economics: Engaging Questions & Answers for Success
Master Class 12 English: Engaging Questions & Answers for Success
Master Class 12 Social Science: Engaging Questions & Answers for Success
Master Class 12 Maths: Engaging Questions & Answers for Success
Master Class 12 Physics: Engaging Questions & Answers for Success
Master Class 9 General Knowledge: Engaging Questions & Answers for Success
Trending doubts
One Metric ton is equal to kg A 10000 B 1000 C 100 class 11 physics CBSE
Difference Between Prokaryotic Cells and Eukaryotic Cells
Two of the body parts which do not appear in MRI are class 11 biology CBSE
1 ton equals to A 100 kg B 1000 kg C 10 kg D 10000 class 11 physics CBSE
10 examples of friction in our daily life
DNA is not present in A Nucleus B Mitochondria C Chloroplast class 11 biology CBSE