


The following distribution gives the marks obtained by \[102\] students of Class X
Marks $0 - 10$ $10 - 20$ $20 - 30$ $30 - 40$ $40 - 50$ $50 - 60$ No. Of Students $9$ $10$ $25$ $50$ $5$ $3$
Convert the above distribution to a less than type cumulative frequency distribution and draw its ogive.
| Marks | $0 - 10$ | $10 - 20$ | $20 - 30$ | $30 - 40$ | $40 - 50$ | $50 - 60$ |
| No. Of Students | $9$ | $10$ | $25$ | $50$ | $5$ | $3$ |
Answer
622.8k+ views
Hint: In this question we will convert the frequency table to a cumulative frequency table and plot the graph and then draw its ogive.
Complete step-by-step solution:
To draw an ogive we require the cumulative frequencies of the values
The distribution table can be written as:
Now to find the Cumulative frequencies in a less than type cumulative frequency we add all the proceeding terms to the current term, Therefore the cumulative frequency table could be written as:
Upon simplifying the above table, we get:
Now, we have to plot the graph with taking the upper limit of Marks on X-axis and the respective cumulative frequency on the Y-axis to get the less than ogive.
The points to be plotted to make a less than ogive are on the graph are: ${\text{(10,9), (20,19), (30,44), (40,94), (50,99), (60,102)}}$.
The Curve in the above graph is the Cumulative Frequency Curve i.e. the ogive.
Note: Ogives are useful for determining the median, percentiles, quartiles and five number summaries of data.
The median is simply the value in the middle value when we order the given data.
A quartile is simply a quarter of its own way from the end or the beginning of a given set of ordered data.
Complete step-by-step solution:
To draw an ogive we require the cumulative frequencies of the values
The distribution table can be written as:
| Marks | No. of Students |
| $0 - 10$ | $9$ |
| $10 - 20$ | $10$ |
| $20 - 30$ | $25$ |
| $30 - 40$ | $50$ |
| $40 - 50$ | $5$ |
| $50 - 60$ | $3$ |
Now to find the Cumulative frequencies in a less than type cumulative frequency we add all the proceeding terms to the current term, Therefore the cumulative frequency table could be written as:
| Marks | No. of Students | Cumulative Frequency |
| $0 - 10$ | $9$ | $9$ |
| $10 - 20$ | $10$ | $9 + 10$ |
| $20 - 30$ | $25$ | $9 + 10 + 25$ |
| $30 - 40$ | $50$ | $9 + 10 + 25 + 50$ |
| $40 - 50$ | $5$ | $9 + 10 + 25 + 50 + 5$ |
| $50 - 60$ | $3$ | $9 + 10 + 25 + 50 + 5 + 3$ |
Upon simplifying the above table, we get:
| Marks | No. of Students | Cumulative Frequency |
| $0 - 10$ | $9$ | $9$ |
| $10 - 20$ | $10$ | $19$ |
| $20 - 30$ | $25$ | $44$ |
| $30 - 40$ | $50$ | $94$ |
| $40 - 50$ | $5$ | $99$ |
| $50 - 60$ | $3$ | $102$ |
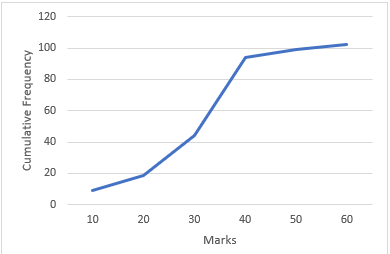
Now, we have to plot the graph with taking the upper limit of Marks on X-axis and the respective cumulative frequency on the Y-axis to get the less than ogive.
The points to be plotted to make a less than ogive are on the graph are: ${\text{(10,9), (20,19), (30,44), (40,94), (50,99), (60,102)}}$.
The Curve in the above graph is the Cumulative Frequency Curve i.e. the ogive.
Note: Ogives are useful for determining the median, percentiles, quartiles and five number summaries of data.
The median is simply the value in the middle value when we order the given data.
A quartile is simply a quarter of its own way from the end or the beginning of a given set of ordered data.
Recently Updated Pages
Master Class 11 English: Engaging Questions & Answers for Success
Master Class 11 Physics: Engaging Questions & Answers for Success
Master Class 11 Computer Science: Engaging Questions & Answers for Success
Master Class 11 Chemistry: Engaging Questions & Answers for Success
Master Class 11 Social Science: Engaging Questions & Answers for Success
Master Class 11 Accountancy: Engaging Questions & Answers for Success
Trending doubts
Difference Between Prokaryotic Cells and Eukaryotic Cells
Two of the body parts which do not appear in MRI are class 11 biology CBSE
One Metric ton is equal to kg A 10000 B 1000 C 100 class 11 physics CBSE
10 examples of friction in our daily life
Draw a diagram of nephron and explain its structur class 11 biology CBSE
Draw a diagram of a plant cell and label at least eight class 11 biology CBSE