


The following data give the number of students using different modes of transport.
Modes of transport Bicycle Bus Walk Train Car Number of students 140 100 70 40 10
Represent the above data using a pie diagram.
| Modes of transport | Bicycle | Bus | Walk | Train | Car |
| Number of students | 140 | 100 | 70 | 40 | 10 |
Answer
588.9k+ views
Hint: These type of questions can be solved by finding the measure of central angle of each element using the formula, \[\dfrac{{{\text{given}}\,\,{\text{value}}}}{{{\text{total}}\,\,{\text{value}}}} \times {360^o}\] , and draw a circle and from the radius mark the central angle of a component of each component with the radius, and continue the process for all the components.
Complete step-by-step answer:
As the question is related to a pie chart we will know about pie chart, Pie charts are used in data handling and are circular charts divided up into segments which each represent a value. Pie charts are divided into sections to represent values of different sizes.
Now given that number of students travelling through different modes of transport is given, 140 students travel by bicycle , 100 students travel by bus , 70 students walk, 40 students travel by train and 10 students travel by car.
Now we know that the measure of centre angle of each element using the formula, \[\dfrac{{{\text{given}}\,\,{\text{value}}}}{{{\text{total}}\,\,{\text{value}}}} \times {360^o}\] ,
Total number of students = \[140 + 100 + 70 + 40 + 10 = 360\] ,
Now using formula,
The measure of centre angle for bicycle \[ = \dfrac{{140}}{{360}} \times 360 = 140\] ,
The measure of centre angle for bus \[ = \dfrac{{100}}{{360}} \times 360 = 100\] ,
The measure of centre angle for walk \[ = \dfrac{{70}}{{360}} \times 360 = 70\] ,
The measure of centre angle for train \[ = \dfrac{{40}}{{360}} \times 360 = 40\] ,
The measure of centre angle for car \[ = \dfrac{{10}}{{360}} \times 360 = 10\] ,
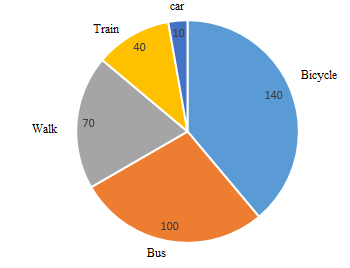
Now represent the data in the pie chart we get the required pie chart,

Final Answer: The required pie chart for the following data is given by,
Note:
The data when is represented on a circular graph which is known as pie chart, in this chart total angle will be of \[{360^o}\] , and the angle for each component is given by formula \[\dfrac{{{\text{given}}\,\,{\text{value}}}}{{{\text{total}}\,\,{\text{value}}}} \times {360^o}\] .
Complete step-by-step answer:
As the question is related to a pie chart we will know about pie chart, Pie charts are used in data handling and are circular charts divided up into segments which each represent a value. Pie charts are divided into sections to represent values of different sizes.
Now given that number of students travelling through different modes of transport is given, 140 students travel by bicycle , 100 students travel by bus , 70 students walk, 40 students travel by train and 10 students travel by car.
Now we know that the measure of centre angle of each element using the formula, \[\dfrac{{{\text{given}}\,\,{\text{value}}}}{{{\text{total}}\,\,{\text{value}}}} \times {360^o}\] ,
Total number of students = \[140 + 100 + 70 + 40 + 10 = 360\] ,
Now using formula,
The measure of centre angle for bicycle \[ = \dfrac{{140}}{{360}} \times 360 = 140\] ,
The measure of centre angle for bus \[ = \dfrac{{100}}{{360}} \times 360 = 100\] ,
The measure of centre angle for walk \[ = \dfrac{{70}}{{360}} \times 360 = 70\] ,
The measure of centre angle for train \[ = \dfrac{{40}}{{360}} \times 360 = 40\] ,
The measure of centre angle for car \[ = \dfrac{{10}}{{360}} \times 360 = 10\] ,
Now represent the data in the pie chart we get the required pie chart,
Final Answer: The required pie chart for the following data is given by,
Note:
The data when is represented on a circular graph which is known as pie chart, in this chart total angle will be of \[{360^o}\] , and the angle for each component is given by formula \[\dfrac{{{\text{given}}\,\,{\text{value}}}}{{{\text{total}}\,\,{\text{value}}}} \times {360^o}\] .
Recently Updated Pages
Master Class 12 Business Studies: Engaging Questions & Answers for Success
Master Class 12 Biology: Engaging Questions & Answers for Success
Master Class 12 Chemistry: Engaging Questions & Answers for Success
Class 12 Question and Answer - Your Ultimate Solutions Guide
Master Class 11 Social Science: Engaging Questions & Answers for Success
Master Class 11 English: Engaging Questions & Answers for Success
Trending doubts
Explain the Treaty of Vienna of 1815 class 10 social science CBSE
Who Won 36 Oscar Awards? Record Holder Revealed
What is the median of the first 10 natural numbers class 10 maths CBSE
Why is it 530 pm in india when it is 1200 afternoon class 10 social science CBSE
What is the full form of POSCO class 10 social science CBSE
The highest temperature in Karnataka is recorded in class 10 social science CBSE