


The favorite flavors of ice cream for students of a school is given in percentages as follows. Represent this data by a pie chart.
Flavors Chocolate Vanilla Strawberry Other flavors Percentage of students preferring the flavors 40% 30% 20% 10%
| Flavors | Chocolate | Vanilla | Strawberry | Other flavors |
| Percentage of students preferring the flavors | 40% | 30% | 20% | 10% |
Answer
594.6k+ views
Hint: First of all, draw a circle. Since the percentage of the student having chocolate, vanilla, strawberry, and other flavor ice cream as their favorite are 40%, 30%, 20%, and 10% respectively, their contribution will also be 40%, 30%, 20%, and 10% respectively in the drawn circle.
Complete step-by-step solution:
According to the question, we have a table that shows the favorite flavors of ice cream for students of a school are given in percentages.
Now, after observing the table, we get
The percentages of the students who have chocolate flavor ice cream as their favorite = 40% ……………………………………………(1)
The percentages of the students who have vanilla flavor ice cream as their favorite = 30% ……………………………………………(2)
The percentages of the students who have strawberry flavor ice cream as their favorite = 20% ……………………………………………(3)
The percentages of the students who have other flavor ice cream as their favorite = 10% …………………………(4)
We have to represent this data using a pie chart.
First of all, let us draw a circle.
Since the percentage of the students having chocolate flavor ice cream as their favorite is 40% so, their contribution will also be 40% in the drawn circle.
Similarly, the percentage of the students having vanilla, strawberry, and other flavor ice cream as their favorite is 30%, 20%, and 10% respectively, so their contribution will also be in the drawn circle.
Now, using these data for drawing the pie chart,
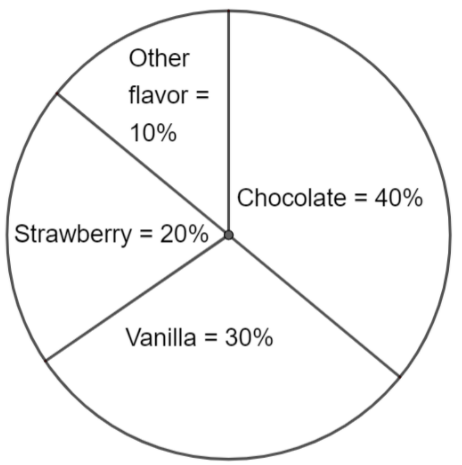
Hence, the above diagram is the required pie chart.
Note: To solve this type of question, keep the point in mind that a pie chart is a diagram consisting of a circle divided into parts that shows the size of a particular part with respect to the whole. Do not get it mistaken for a bar chart.
Complete step-by-step solution:
According to the question, we have a table that shows the favorite flavors of ice cream for students of a school are given in percentages.
Now, after observing the table, we get
The percentages of the students who have chocolate flavor ice cream as their favorite = 40% ……………………………………………(1)
The percentages of the students who have vanilla flavor ice cream as their favorite = 30% ……………………………………………(2)
The percentages of the students who have strawberry flavor ice cream as their favorite = 20% ……………………………………………(3)
The percentages of the students who have other flavor ice cream as their favorite = 10% …………………………(4)
We have to represent this data using a pie chart.
First of all, let us draw a circle.
Since the percentage of the students having chocolate flavor ice cream as their favorite is 40% so, their contribution will also be 40% in the drawn circle.
Similarly, the percentage of the students having vanilla, strawberry, and other flavor ice cream as their favorite is 30%, 20%, and 10% respectively, so their contribution will also be in the drawn circle.
Now, using these data for drawing the pie chart,
Hence, the above diagram is the required pie chart.
Note: To solve this type of question, keep the point in mind that a pie chart is a diagram consisting of a circle divided into parts that shows the size of a particular part with respect to the whole. Do not get it mistaken for a bar chart.
Recently Updated Pages
Master Class 10 Social Science: Engaging Questions & Answers for Success
Master Class 10 Science: Engaging Questions & Answers for Success
Master Class 10 Maths: Engaging Questions & Answers for Success
Master Class 10 General Knowledge: Engaging Questions & Answers for Success
Master Class 10 Computer Science: Engaging Questions & Answers for Success
Class 10 Question and Answer - Your Ultimate Solutions Guide
Trending doubts
What is the full form of PNG A Petrol Natural Gas B class 10 chemistry CBSE
Explain the Treaty of Vienna of 1815 class 10 social science CBSE
In cricket, how many legal balls are there in a standard over?
Why is there a time difference of about 5 hours between class 10 social science CBSE
Who Won 36 Oscar Awards? Record Holder Revealed
What is the median of the first 10 natural numbers class 10 maths CBSE