


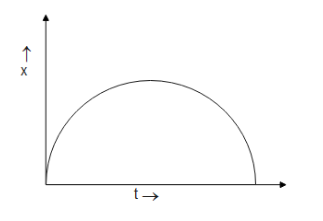
The displacement-time $(x,t)$ graph of a body is given, find the corresponding velocity-time $(v,t)$.
Answer
513.3k+ views
Hint: To plot the velocity-time relation we need to analyze velocity at every point in the displacement-time graph and also have a clear idea about the direction of it since velocity is a vector quantity, it can be negative or positive depending upon its direction.
Complete step by step answer:
Now let us redraw the given diagram for better understanding.
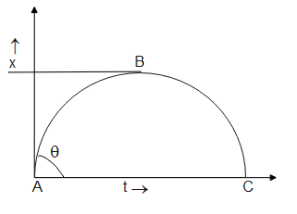
$\overrightarrow v = \dfrac{{d\overrightarrow x }}{{dt}}$ which is the slope of the graph $(x,t)$.As we go from ${\text{A}} \to {\text{B}}$, $\theta $ decreases which means the slope of the plot decreases and thus the velocity decreases. The value of velocity remains positive throughout this path.Now as a point ${\text{B}}$, $\theta $ becomes zero which means the slope of the plot becomes zero and thus the velocity also becomes zero.
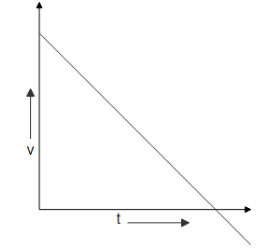
As we go further ${\text{B}} \to {\text{C}}$, $\theta $ increases in the negative direction meaning the slope of the plot becomes negative and thus the velocity becomes negative and decreases further. From the above cases, we can now conclude the velocity-time plot, which can be shown as
Note: It should be noted that both velocity and displacement is a vector quantity that has both magnitude as well as direction. For plotting velocity-time or displacement-time, one needs to understand the direction in which it is acting, unlike distance which is a scalar quantity and does not concern the direction involved. Therefore when we say that the distance covered is uniform it only signifies the magnitude, the direction may or may not change but when we say that velocity is uniform, both direction and magnitude remains constant.
Complete step by step answer:
Now let us redraw the given diagram for better understanding.
$\overrightarrow v = \dfrac{{d\overrightarrow x }}{{dt}}$ which is the slope of the graph $(x,t)$.As we go from ${\text{A}} \to {\text{B}}$, $\theta $ decreases which means the slope of the plot decreases and thus the velocity decreases. The value of velocity remains positive throughout this path.Now as a point ${\text{B}}$, $\theta $ becomes zero which means the slope of the plot becomes zero and thus the velocity also becomes zero.
As we go further ${\text{B}} \to {\text{C}}$, $\theta $ increases in the negative direction meaning the slope of the plot becomes negative and thus the velocity becomes negative and decreases further. From the above cases, we can now conclude the velocity-time plot, which can be shown as
Note: It should be noted that both velocity and displacement is a vector quantity that has both magnitude as well as direction. For plotting velocity-time or displacement-time, one needs to understand the direction in which it is acting, unlike distance which is a scalar quantity and does not concern the direction involved. Therefore when we say that the distance covered is uniform it only signifies the magnitude, the direction may or may not change but when we say that velocity is uniform, both direction and magnitude remains constant.
Recently Updated Pages
Basicity of sulphurous acid and sulphuric acid are
Master Class 11 Business Studies: Engaging Questions & Answers for Success
Master Class 11 Computer Science: Engaging Questions & Answers for Success
Master Class 11 Economics: Engaging Questions & Answers for Success
Master Class 11 Social Science: Engaging Questions & Answers for Success
Master Class 11 English: Engaging Questions & Answers for Success
Trending doubts
One Metric ton is equal to kg A 10000 B 1000 C 100 class 11 physics CBSE
The largest wind power cluster is located in the state class 11 social science CBSE
Explain zero factorial class 11 maths CBSE
State and prove Bernoullis theorem class 11 physics CBSE
What steps did the French revolutionaries take to create class 11 social science CBSE
Which among the following are examples of coming together class 11 social science CBSE