


The data on modes of transport used by students to come to school are given . Represent the data with the help of a pie chart.
Mode of transport Bus Cycle Scooter Car Walking Percentage of students $40\% $ $30\% $ $10\% $ $5\% $ $15\% $
| Mode of transport | Bus | Cycle | Scooter | Car | Walking |
| Percentage of students | $40\% $ | $30\% $ | $10\% $ | $5\% $ | $15\% $ |
Answer
596.4k+ views
Hint:
First find out the angle that subtends on the centre of the pie chart its formula is equal to \[\dfrac{{{\text{Percentage of students }} \times {\text{ 360}}^\circ }}{{100}}\] after finding the angle of each mode of transport draw the pie chart .
Complete step by step solution:
In this question we have to make the pie chart of the given data on modes of transport used by students to come to school .
So for making the pie chart first we have to divide the angle of circle , as we know that the whole circle make $360^\circ $ at the centre of it , so we have to divide $360^\circ $ according to the percentage of students
As from the given we have know that the percentage of students
So the given mode of transport sustain angle at centre is equal to
= \[\dfrac{{{\text{Percentage of students }} \times {\text{ 360}}^\circ }}{{100}}\]
For mode of transport of Bus is $40\% $
Angle at centre is equal to $\dfrac{{40 \times 360}}{{100}}$ = $144^\circ $
For mode of transport of cycle is $30\% $
Angle at centre is equal to $\dfrac{{30 \times 360}}{{100}}$ = $108^\circ $
For mode of scooter of Bus is $10\% $
Angle at centre is equal to $\dfrac{{10 \times 360}}{{100}}$ = $36^\circ $
For mode of transport of car is $5\% $
Angle at centre is equal to $\dfrac{{5 \times 360}}{{100}}$ = $18^\circ $
For mode of transport of walking is $15\% $
Angle at centre is equal to $\dfrac{{15 \times 360}}{{100}}$ = $54^\circ $
Hence make pie chart and divide the angle subtends at the centre of circle as following
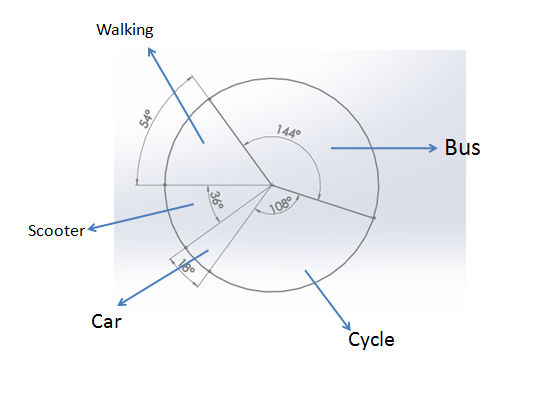
It is a required pie chart .
Note:
There are many types of chart for example pie chart , Bar chart ,Line chart , Area chart etc
For comparing the frequencies of the given data we will use the Bar Charts for example if we have to compare that Runs scored by a batsmen in the following years so we make the bar chart of the Batsman runs vs. year from here we will compare easily .
A line chart is a graphical representation of an asset's historical price action that connects a series of data points with a continuous line
First find out the angle that subtends on the centre of the pie chart its formula is equal to \[\dfrac{{{\text{Percentage of students }} \times {\text{ 360}}^\circ }}{{100}}\] after finding the angle of each mode of transport draw the pie chart .
Complete step by step solution:
In this question we have to make the pie chart of the given data on modes of transport used by students to come to school .
So for making the pie chart first we have to divide the angle of circle , as we know that the whole circle make $360^\circ $ at the centre of it , so we have to divide $360^\circ $ according to the percentage of students
As from the given we have know that the percentage of students
So the given mode of transport sustain angle at centre is equal to
= \[\dfrac{{{\text{Percentage of students }} \times {\text{ 360}}^\circ }}{{100}}\]
For mode of transport of Bus is $40\% $
Angle at centre is equal to $\dfrac{{40 \times 360}}{{100}}$ = $144^\circ $
For mode of transport of cycle is $30\% $
Angle at centre is equal to $\dfrac{{30 \times 360}}{{100}}$ = $108^\circ $
For mode of scooter of Bus is $10\% $
Angle at centre is equal to $\dfrac{{10 \times 360}}{{100}}$ = $36^\circ $
For mode of transport of car is $5\% $
Angle at centre is equal to $\dfrac{{5 \times 360}}{{100}}$ = $18^\circ $
For mode of transport of walking is $15\% $
Angle at centre is equal to $\dfrac{{15 \times 360}}{{100}}$ = $54^\circ $
Hence make pie chart and divide the angle subtends at the centre of circle as following
| Mode of transport | Bus | Cycle | Scooter | Car | Walking |
| Percentage of students | $40\% $ | $30\% $ | $10\% $ | $5\% $ | $15\% $ |
| Angle subtended at centre of pie chart | $144^\circ $ | $108^\circ $ | $36^\circ $ | $18^\circ $ | $54^\circ $ |
It is a required pie chart .
Note:
There are many types of chart for example pie chart , Bar chart ,Line chart , Area chart etc
For comparing the frequencies of the given data we will use the Bar Charts for example if we have to compare that Runs scored by a batsmen in the following years so we make the bar chart of the Batsman runs vs. year from here we will compare easily .
A line chart is a graphical representation of an asset's historical price action that connects a series of data points with a continuous line
Recently Updated Pages
Master Class 10 Social Science: Engaging Questions & Answers for Success
Master Class 10 Science: Engaging Questions & Answers for Success
Master Class 10 Maths: Engaging Questions & Answers for Success
Master Class 10 General Knowledge: Engaging Questions & Answers for Success
Master Class 10 Computer Science: Engaging Questions & Answers for Success
Class 10 Question and Answer - Your Ultimate Solutions Guide
Trending doubts
Explain the Treaty of Vienna of 1815 class 10 social science CBSE
In cricket, how many legal balls are there in a standard over?
Why is there a time difference of about 5 hours between class 10 social science CBSE
Who Won 36 Oscar Awards? Record Holder Revealed
What is the median of the first 10 natural numbers class 10 maths CBSE
Distinguish between the reserved forests and protected class 10 biology CBSE