


The complete set of real values of ‘x’ for which, ${{e}^{x}}>1+x$, is equal to:
$\begin{align}
& \left( A \right)\left( -\infty ,\infty \right) \\
& \left( B \right)\left( 0,\infty \right) \\
& \left( C \right)\left( -\infty ,0 \right) \\
& \left( D \right)\left( -\infty ,0 \right)\cup \left( 0,\infty \right) \\
\end{align}$
Answer
522.9k+ views
Hint: The given problem is a problem based on equality and inequality. And there are two standard approaches to solve an expression containing an inequality. In the first method, we manipulate the expression to break it into an equality whose solution can be easily identified and in the second method, we plot the graphs of both the terms on either side of the inequality and then compare them to get our answer. Here, we shall proceed using the second method.
Complete step by step answer:
We have the inequality given to us as: ${{e}^{x}}>1+x$. Here, we can clearly identify the two terms on either side of the inequality. Let us denote them in the following manner:
$\begin{align}
& \Rightarrow f\left( x \right)={{e}^{x}} \\
& \Rightarrow g\left( x \right)=1+x \\
\end{align}$
Now, our equation can be re-written as:
$\Rightarrow f\left( x \right)>g\left( x \right)$
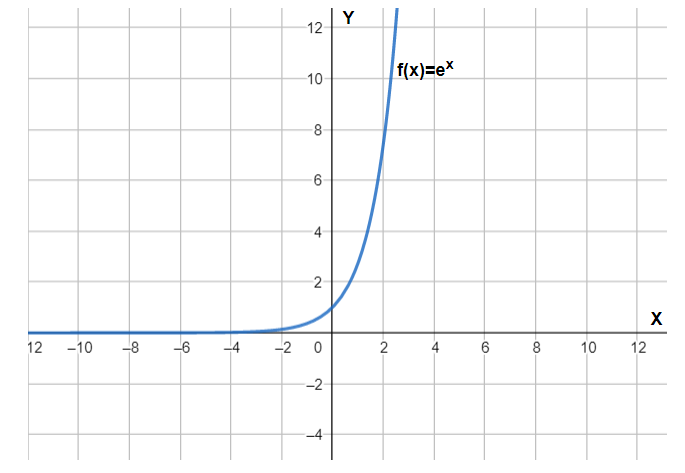
Let us plot our first function, that is f(x). Here, f(x) is a simple exponential function so it can be plotted using the properties mentioned as follows:
The output of the exponential function is 0 at $-\infty $.
The output of the exponential function is 1 at 0.
The output of the exponential function is $+\infty $when ‘x’ approaches $+\infty $.
And, it is an increasing function.
Thus, our plot of an exponential function is:
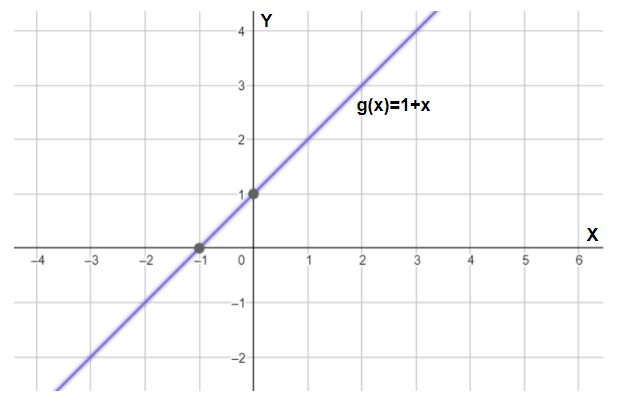
Now, we will plot the second function g(x). Here, g(x) is a straight line. Some of its properties are:
X-intercept (x-value at $y=0$) is equal to $-1$.
Y-intercept (y-value at $x=0$) is equal to 1.
And, the slope of the line is equal to:
$\begin{align}
& \Rightarrow \dfrac{d\left[ g\left( x \right) \right]}{dx}=d\dfrac{\left( 1+x \right)}{dx} \\
& \Rightarrow \dfrac{d\left[ g\left( x \right) \right]}{dx}=1 \\
\end{align}$
Thus, our line can be constructed as follows:
Now, we will plot the two above graphs in the same coordinate system and then compare them. This is can be done as follows:
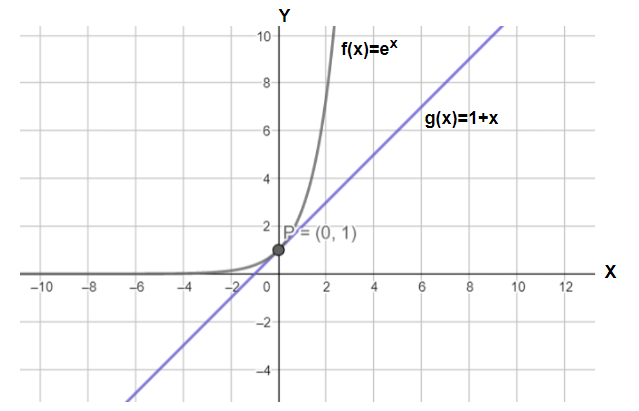
Here, we can clearly see that:
For, $\left( x<0 \right)\text{ : }{{e}^{x}}<1+x$. And,
For, $\left( x>0 \right)\text{ : }{{e}^{x}}>1+x$
Hence, our solution set for the inequality, ${{e}^{x}}>1+x$, comes out to be $\left( 0,\infty \right)$.
So, the correct answer is “Option B”.
Note: Whenever compiling two graph plots, we should always take care of the common points. Also, the graph plot should be neat and clean for better understanding of the problem. Here, the approach for manipulating both the sides of our expression would not work out because we cannot separate our variable ‘x’ from exponential as well as linear function.
Complete step by step answer:
We have the inequality given to us as: ${{e}^{x}}>1+x$. Here, we can clearly identify the two terms on either side of the inequality. Let us denote them in the following manner:
$\begin{align}
& \Rightarrow f\left( x \right)={{e}^{x}} \\
& \Rightarrow g\left( x \right)=1+x \\
\end{align}$
Now, our equation can be re-written as:
$\Rightarrow f\left( x \right)>g\left( x \right)$
Let us plot our first function, that is f(x). Here, f(x) is a simple exponential function so it can be plotted using the properties mentioned as follows:
The output of the exponential function is 0 at $-\infty $.
The output of the exponential function is 1 at 0.
The output of the exponential function is $+\infty $when ‘x’ approaches $+\infty $.
And, it is an increasing function.
Thus, our plot of an exponential function is:
Now, we will plot the second function g(x). Here, g(x) is a straight line. Some of its properties are:
X-intercept (x-value at $y=0$) is equal to $-1$.
Y-intercept (y-value at $x=0$) is equal to 1.
And, the slope of the line is equal to:
$\begin{align}
& \Rightarrow \dfrac{d\left[ g\left( x \right) \right]}{dx}=d\dfrac{\left( 1+x \right)}{dx} \\
& \Rightarrow \dfrac{d\left[ g\left( x \right) \right]}{dx}=1 \\
\end{align}$
Thus, our line can be constructed as follows:
Now, we will plot the two above graphs in the same coordinate system and then compare them. This is can be done as follows:
Here, we can clearly see that:
For, $\left( x<0 \right)\text{ : }{{e}^{x}}<1+x$. And,
For, $\left( x>0 \right)\text{ : }{{e}^{x}}>1+x$
Hence, our solution set for the inequality, ${{e}^{x}}>1+x$, comes out to be $\left( 0,\infty \right)$.
So, the correct answer is “Option B”.
Note: Whenever compiling two graph plots, we should always take care of the common points. Also, the graph plot should be neat and clean for better understanding of the problem. Here, the approach for manipulating both the sides of our expression would not work out because we cannot separate our variable ‘x’ from exponential as well as linear function.
Recently Updated Pages
Master Class 10 Computer Science: Engaging Questions & Answers for Success
Master Class 10 General Knowledge: Engaging Questions & Answers for Success
Master Class 10 English: Engaging Questions & Answers for Success
Master Class 10 Social Science: Engaging Questions & Answers for Success
Master Class 10 Maths: Engaging Questions & Answers for Success
Master Class 10 Science: Engaging Questions & Answers for Success
Trending doubts
What is the median of the first 10 natural numbers class 10 maths CBSE
Which women's tennis player has 24 Grand Slam singles titles?
Who is the Brand Ambassador of Incredible India?
Why is there a time difference of about 5 hours between class 10 social science CBSE
Write a letter to the principal requesting him to grant class 10 english CBSE
A moving boat is observed from the top of a 150 m high class 10 maths CBSE