


The below table shows the favourite sports of 250 students of a school. Represent the data by a bar graph.
Sports Cricket Tennis Football Badminton Swimming Number of students 75 50 35 25 65
| Sports | Cricket | Tennis | Football | Badminton | Swimming |
| Number of students | 75 | 50 | 35 | 25 | 65 |
Answer
554.4k+ views
Hint: For solving this question you should know about the bar graph representation. In this problem we will set our data in a good manner and show them with the help of a bar graph. In this process we will divide a big box in some small boxes as per our requirement.
Complete step-by-step solution:
According to our question it is asked to represent some data by a bar graph. As we know that a bar graph is a form of graphs in which we represent the data with the help of bar. In this process we collect the data for various sources and then we represent them in a graph. And in this we have consider small divisions and for his we divide the big divisions into small divisions. So, we can draw a graph by following these steps:
Step 1: On a graph, draw a vertical line OY and horizontal line OX. These lines represents y-axis and x-axis.
Step 2: Along OX write the name of the sports taken at uniform gaps.
Step 3: Choose the scale: 1 small division = 1 student, 1 big division = 10 students.
Step 4: Calculate the height of various bars.
Cricket = 75 small divisions
Football = 35 small divisions
Tennis = 50 small divisions
Badminton = 25 small divisions
Swimming = 65 small divisions
Step 5: Represent these as:
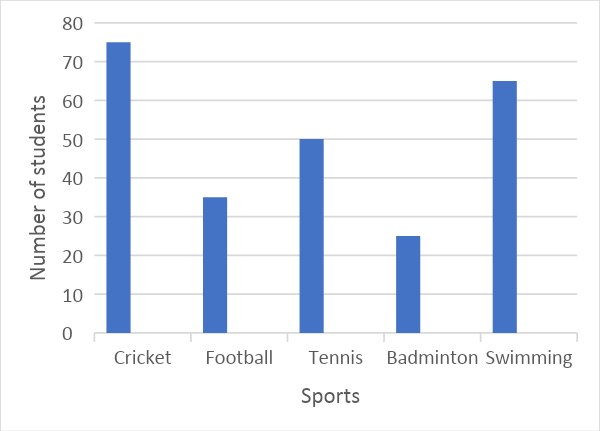
Note: While solving these types of graph questions, you have to be especially careful about choosing the scale for the graph. Because if you select a small scale, then it will not include all the data and if it is big, then it will leave some data for sure. So, the scale must be such that it includes all the data.
Complete step-by-step solution:
According to our question it is asked to represent some data by a bar graph. As we know that a bar graph is a form of graphs in which we represent the data with the help of bar. In this process we collect the data for various sources and then we represent them in a graph. And in this we have consider small divisions and for his we divide the big divisions into small divisions. So, we can draw a graph by following these steps:
Step 1: On a graph, draw a vertical line OY and horizontal line OX. These lines represents y-axis and x-axis.
Step 2: Along OX write the name of the sports taken at uniform gaps.
Step 3: Choose the scale: 1 small division = 1 student, 1 big division = 10 students.
Step 4: Calculate the height of various bars.
Cricket = 75 small divisions
Football = 35 small divisions
Tennis = 50 small divisions
Badminton = 25 small divisions
Swimming = 65 small divisions
Step 5: Represent these as:
Note: While solving these types of graph questions, you have to be especially careful about choosing the scale for the graph. Because if you select a small scale, then it will not include all the data and if it is big, then it will leave some data for sure. So, the scale must be such that it includes all the data.

Recently Updated Pages
Master Class 11 English: Engaging Questions & Answers for Success
Master Class 11 Social Science: Engaging Questions & Answers for Success
Master Class 11 Maths: Engaging Questions & Answers for Success
Master Class 11 Biology: Engaging Questions & Answers for Success
Master Class 11 Physics: Engaging Questions & Answers for Success
Master Class 11 Chemistry: Engaging Questions & Answers for Success
Trending doubts
Full Form of IASDMIPSIFSIRSPOLICE class 7 social science CBSE
Write in numerals Ten lakh ninety thousand nine hundred class 7 maths CBSE
How many crores make 10 million class 7 maths CBSE
One lakh eight thousand how can we write it in num class 7 maths CBSE
One lakh eight thousand how can we write it in num class 7 maths CBSE
List of coprime numbers from 1 to 100 class 7 maths CBSE