


The area under the acceleration-time graph gives:
A.) Distance travelled
B.) Change in direction
C.) Force acting
D.) Change in velocity
Answer
642k+ views
Hint: Try to understand the concept of graphs between two physical quantities. Draw an acceleration-time graph. Try to find the area of the graph with the help of physical notations. Then we can find our answer.
Complete step by step answer:
An acceleration-time graph is represented as the acceleration on the y-axis or the vertical axis and time in the x-axis or the horizontal axis. The value of the graph at a particular time will give us the acceleration of the object at that point of time.
Slope of an acceleration-time graph is known as a jerk. It gives us the rate of change of acceleration.
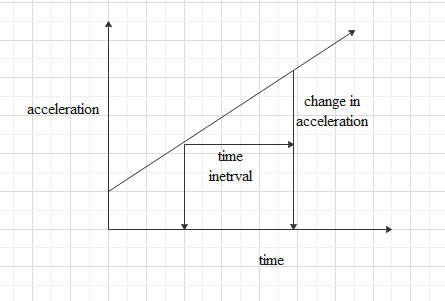
We can find the area under the acceleration-time graph for a certain time interval.
Area under the graph can be defined as, $\text{area }=\Delta a\times \Delta t$
Where, $\Delta t$ is the time interval and $\Delta a$ the change in acceleration in that time interval.
Now we can find acceleration as,
$\Delta a=\dfrac{\Delta v}{\Delta t}$
So, by multiplying both sides of equation by $\Delta t$ , we can write,
$\Delta a\times \Delta t=\Delta v$
So, the area under the acceleration-time graph can be given as,
$\text{area }=\Delta a\times \Delta t=\Delta v$
Which is the rate of change of velocity.
So, the area under any acceleration time graph at a certain time interval will give us the rate of change of velocity.
The correct option is (a).
Note: For a constant acceleration we will get a linear graph parallel to the time axis. If we have a uniformly increasing acceleration, we will get a straight line with a slope. For non-uniform acceleration we won’t get a straight-line graph.
Complete step by step answer:
An acceleration-time graph is represented as the acceleration on the y-axis or the vertical axis and time in the x-axis or the horizontal axis. The value of the graph at a particular time will give us the acceleration of the object at that point of time.
Slope of an acceleration-time graph is known as a jerk. It gives us the rate of change of acceleration.
We can find the area under the acceleration-time graph for a certain time interval.
Area under the graph can be defined as, $\text{area }=\Delta a\times \Delta t$
Where, $\Delta t$ is the time interval and $\Delta a$ the change in acceleration in that time interval.
Now we can find acceleration as,
$\Delta a=\dfrac{\Delta v}{\Delta t}$
So, by multiplying both sides of equation by $\Delta t$ , we can write,
$\Delta a\times \Delta t=\Delta v$
So, the area under the acceleration-time graph can be given as,
$\text{area }=\Delta a\times \Delta t=\Delta v$
Which is the rate of change of velocity.
So, the area under any acceleration time graph at a certain time interval will give us the rate of change of velocity.
The correct option is (a).
Note: For a constant acceleration we will get a linear graph parallel to the time axis. If we have a uniformly increasing acceleration, we will get a straight line with a slope. For non-uniform acceleration we won’t get a straight-line graph.
Recently Updated Pages
Master Class 11 English: Engaging Questions & Answers for Success
Master Class 11 Social Science: Engaging Questions & Answers for Success
Master Class 11 Maths: Engaging Questions & Answers for Success
Master Class 11 Biology: Engaging Questions & Answers for Success
Master Class 11 Physics: Engaging Questions & Answers for Success
Master Class 11 Chemistry: Engaging Questions & Answers for Success
Trending doubts
One Metric ton is equal to kg A 10000 B 1000 C 100 class 11 physics CBSE
Difference Between Prokaryotic Cells and Eukaryotic Cells
Find the value of the expression given below sin 30circ class 11 maths CBSE
Two of the body parts which do not appear in MRI are class 11 biology CBSE
Draw a diagram of a plant cell and label at least eight class 11 biology CBSE
10 examples of friction in our daily life