


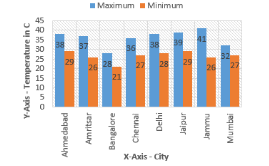
Take the data giving the minimum and the maximum temperature of the various cities given in the beginning of this chapter. Plot a double bar graph using the data and answer the following:
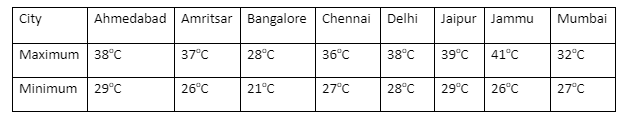
Temperature of the cities as on 20.6.2006
Which is the warmest city and which is the coldest city?
Answer
628.2k+ views
Hint: Here, we are given the maximum and minimum temperatures of various cities. The temperature is from ${{21}^{\circ }}C$ to ${{41}^{\circ }}C$. So, we can draw a bar graph from 0 to 45 with a gap of 5. In graph x – axis denotes the city and y – axis denotes the temperature. Now, after constructing the bar graph with the given data, we can find the warmest city from the graph, the city which has the highest maximum temperature and coldest city, the city that has the lowest minimum temperature.
Complete step-by-step answer:
Here, a table is given which shows different cities with maximum and minimum temperature.
Now, we have to plot a double bar graph.
We know that a bar graph can be defined as a chart or a graphical representation of data, quantities or numbers using bars or strips. Bar graphs are used to compare and contrast numbers, frequencies or other measures of distinct categories of data.
We also know that double bar graphs, also called double bar charts, help us to compare or present more than one kind of information, situations or events instead of just one by using bars.
Here, temperature is from ${{21}^{\circ }}C$ to ${{41}^{\circ }}C$. So, we can draw a bar graph from 0 to 45 with a gap of 5.
Now, we have to find the warmest and coldest city.
We know that the warmest city is the one which has the highest maximum temperature. From the bar graph we can easily say that maximum temperature in Jammu is ${{41}^{\circ }}C$ , which is the highest temperature among all other cities.
Similarly, we can say that the coldest city is the one which has the lowest minimum temperature. From the bar graph we can see that the minimum temperature in Bangalore is ${{21}^{\circ }}C$, which has the lowest temperature among all other cities.
Hence, we can say that the warmest city is Jammu and the coldest city is Bangalore.
Note: Bar graphs are used to compare things between different groups or to track changes over time. Especially, bar graphs are best when the changes are larger. Here, by using a bar graph we can easily compare the temperature among various cities.
Recently Updated Pages
Master Class 10 Social Science: Engaging Questions & Answers for Success
Master Class 10 Science: Engaging Questions & Answers for Success
Master Class 10 Maths: Engaging Questions & Answers for Success
Master Class 10 General Knowledge: Engaging Questions & Answers for Success
Master Class 10 Computer Science: Engaging Questions & Answers for Success
Class 10 Question and Answer - Your Ultimate Solutions Guide
Trending doubts
What is the full form of PNG A Petrol Natural Gas B class 10 chemistry CBSE
Explain the Treaty of Vienna of 1815 class 10 social science CBSE
In cricket, how many legal balls are there in a standard over?
Why is there a time difference of about 5 hours between class 10 social science CBSE
Who Won 36 Oscar Awards? Record Holder Revealed
What is the median of the first 10 natural numbers class 10 maths CBSE