


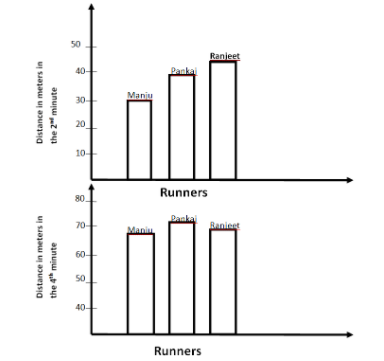
Study the graph below showing the position of three runners, Manju, Pankaj and Ranjeet at two different times.
Who has run the fastest in between the 2nd and 4th minute?
Answer
574.5k+ views
Hint: Here we have to check who has run the fastest. For that, we will first find the distance covered by Manju, Pankaj and Ranjeet in the 2nd minute and then find the distance covered by Manju, Pankaj and Ranjeet in the 4th minute. We will calculate the difference of their respective distances covered in the 2nd minute and 4th minute. The more the difference of their distance, the faster the distance covered.
Complete step-by-step answer:
We will first find the distance covered by Manju in the 2nd minute.
We can see from the graph that the distance covered by Manju in the 2nd minute is 30 m.
Now, we will find the distance covered by Pankaj in the 2nd minute.
We can see from the graph that the distance covered by Pankaj in the 2nd minute is 40 m.
We will first find the distance covered by Ranjeet in the 2nd minute.
We can see from the graph that the distance covered by Ranjeet in the 2nd minute is 45 m.
Now, we will find the distance covered by Manju in the 4th minute.
We can see from the graph that the distance covered by Manju in the 4th minute is 68 m.
Now, we will find the distance covered by Pankaj in the 4th minute.
We can see from the graph that the distance covered by Pankaj in the 4th minute is 70 m.
We will first find the distance covered by Ranjeet in the 4th minute.
We can see from the graph that the distance covered by Ranjeet in the 4th minute is 69 m.
Now, we will calculate the distance covered by Manju between 2nd and 4th minute by subtracting them.
Distance covered between 2nd and 4th minute $68-30=38m$
Now, we will calculate the distance covered by Pankaj between 2nd and 4th minute by subtracting them.
Distance covered between 2nd and 4th minute $70-40=30m$
Now, we will calculate the distance covered by Ranjeet between 2nd and 4th minute by subtracting them.
Distance covered between 2nd and 4th minute $69-45=24m$
Thus, distance covered Manju between 2nd and 4th minute is more than Pankaj and Ranjeet.
Therefore, Manju has run the fastest in between the 2nd and 4th minute.
Note: The bar graph shown above is known as vertical bar graph. Here the grouped data are represented vertically in a graph with the help of bars, where the bars represent the measure of data, and thus such graphs are called vertical bar graphs.
Recently Updated Pages
Master Class 10 Computer Science: Engaging Questions & Answers for Success
Master Class 10 General Knowledge: Engaging Questions & Answers for Success
Master Class 10 English: Engaging Questions & Answers for Success
Master Class 10 Social Science: Engaging Questions & Answers for Success
Master Class 10 Maths: Engaging Questions & Answers for Success
Master Class 10 Science: Engaging Questions & Answers for Success
Trending doubts
What is the median of the first 10 natural numbers class 10 maths CBSE
Which women's tennis player has 24 Grand Slam singles titles?
Who is the Brand Ambassador of Incredible India?
Why is there a time difference of about 5 hours between class 10 social science CBSE
Write a letter to the principal requesting him to grant class 10 english CBSE
State and prove converse of BPT Basic Proportionality class 10 maths CBSE