


Solve the following inequality graphically in two-dimensional plane:
$x - y \leqslant 2$
Answer
519.6k+ views
Hint: To solve any inequality graphically, first we have to graph the equality and then determine the region the given inequality satisfies. The solution of any inequality is the region towards which all the points lying satisfy the given inequality.
Complete step-by-step solution:
We are given the inequality $x - y \leqslant 2$, and we are required to draw it graphically in a two-dimensional plane.
To solve the inequality graphically, we need to first draw the equality in the two-dimensional plane.
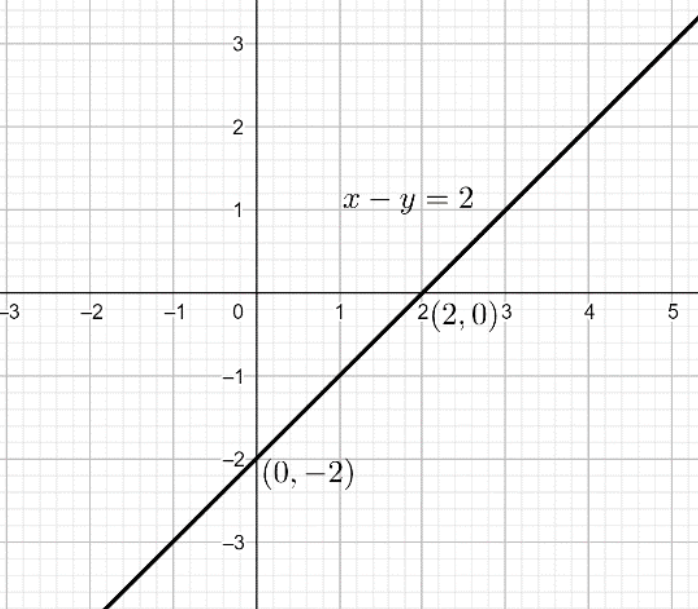
That is, we have to draw $x - y = 2$ in the two-dimensional plane.
To draw this equality, we have to first determine the intercepts of the given equality.
First determine the $x$ intercept,
Substitute $y = 0$ in the given equality $x - y = 2$,
We get $x = 2$, so $x$ intercept is $2$.
Now, determine the $y$ intercept,
Substitute $x = 0$ in the given equality $x - y = 2$,
We get $y = - 2$, so $y$ intercept is $ - 2$.
Hence, we get the points $(2,0)$ and $(0, - 2)$.
To draw the graph of the equality $x - y = 2$, we will plot the above-mentioned points on the graph and then join the points.
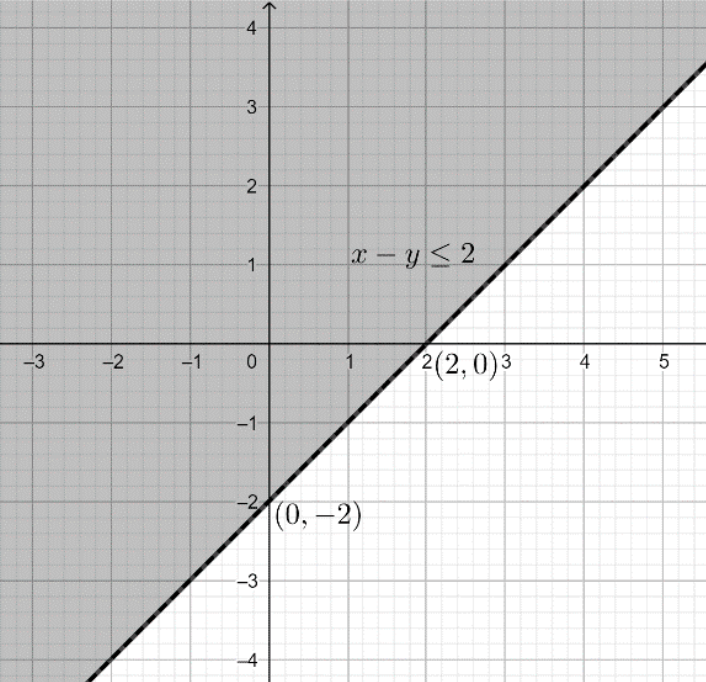
Now, we have to illustrate the inequality part, that is $x - y \leqslant 2$.
To check the solution of the inequality, we take any random point not lying on the graph of equality, say $(0,0)$, this point does not satisfy the equality $x - y = 2$.
Substitute the point $(0,0)$ in the inequality $x - y \leqslant 2$, and check if it satisfies the inequality or not.
Since $x - y = 0 - 0 = 0$ and $0 \leqslant 2$, so the point satisfies the inequality.
Hence, the solution of the inequality $x - y \leqslant 2$ is the region lying towards the selected point that is towards $(0,0)$. The shaded region in the below graph is the solution of the inequality $x - y \leqslant 2$.
Note: The points taken into consideration for determining the shaded region in the inequality should not lie on the graph of the equality, or it can be said that the points considered for determining the shaded region should not be the solution of the equality and not satisfy the equation.
Complete step-by-step solution:
We are given the inequality $x - y \leqslant 2$, and we are required to draw it graphically in a two-dimensional plane.
To solve the inequality graphically, we need to first draw the equality in the two-dimensional plane.
That is, we have to draw $x - y = 2$ in the two-dimensional plane.
To draw this equality, we have to first determine the intercepts of the given equality.
First determine the $x$ intercept,
Substitute $y = 0$ in the given equality $x - y = 2$,
We get $x = 2$, so $x$ intercept is $2$.
Now, determine the $y$ intercept,
Substitute $x = 0$ in the given equality $x - y = 2$,
We get $y = - 2$, so $y$ intercept is $ - 2$.
Hence, we get the points $(2,0)$ and $(0, - 2)$.
To draw the graph of the equality $x - y = 2$, we will plot the above-mentioned points on the graph and then join the points.
Now, we have to illustrate the inequality part, that is $x - y \leqslant 2$.
To check the solution of the inequality, we take any random point not lying on the graph of equality, say $(0,0)$, this point does not satisfy the equality $x - y = 2$.
Substitute the point $(0,0)$ in the inequality $x - y \leqslant 2$, and check if it satisfies the inequality or not.
Since $x - y = 0 - 0 = 0$ and $0 \leqslant 2$, so the point satisfies the inequality.
Hence, the solution of the inequality $x - y \leqslant 2$ is the region lying towards the selected point that is towards $(0,0)$. The shaded region in the below graph is the solution of the inequality $x - y \leqslant 2$.
Note: The points taken into consideration for determining the shaded region in the inequality should not lie on the graph of the equality, or it can be said that the points considered for determining the shaded region should not be the solution of the equality and not satisfy the equation.
Recently Updated Pages
Three beakers labelled as A B and C each containing 25 mL of water were taken A small amount of NaOH anhydrous CuSO4 and NaCl were added to the beakers A B and C respectively It was observed that there was an increase in the temperature of the solutions contained in beakers A and B whereas in case of beaker C the temperature of the solution falls Which one of the following statements isarecorrect i In beakers A and B exothermic process has occurred ii In beakers A and B endothermic process has occurred iii In beaker C exothermic process has occurred iv In beaker C endothermic process has occurred
Master Class 11 Social Science: Engaging Questions & Answers for Success
Master Class 11 Physics: Engaging Questions & Answers for Success
Master Class 11 Maths: Engaging Questions & Answers for Success
Master Class 11 Economics: Engaging Questions & Answers for Success
Master Class 11 Computer Science: Engaging Questions & Answers for Success
Three beakers labelled as A B and C each containing 25 mL of water were taken A small amount of NaOH anhydrous CuSO4 and NaCl were added to the beakers A B and C respectively It was observed that there was an increase in the temperature of the solutions contained in beakers A and B whereas in case of beaker C the temperature of the solution falls Which one of the following statements isarecorrect i In beakers A and B exothermic process has occurred ii In beakers A and B endothermic process has occurred iii In beaker C exothermic process has occurred iv In beaker C endothermic process has occurred
Master Class 11 Social Science: Engaging Questions & Answers for Success
Master Class 11 Physics: Engaging Questions & Answers for Success
Trending doubts
One Metric ton is equal to kg A 10000 B 1000 C 100 class 11 physics CBSE
There are 720 permutations of the digits 1 2 3 4 5 class 11 maths CBSE
State and prove Bernoullis theorem class 11 physics CBSE
Draw a diagram of a plant cell and label at least eight class 11 biology CBSE
Difference Between Prokaryotic Cells and Eukaryotic Cells
Discuss the various forms of bacteria class 11 biology CBSE