


How do you solve and graph for $\dfrac{x}{4} < 9?$
Answer
550.8k+ views
Hint:First of all, solve the given inequality for the value of $x$ then replace the inequality with equality sign and then draw the graph for the equation. Now pick up any point other than on the graph of the equation and check it on the inequality, if it satisfies it then shade portion of the point’s side and if not then shade the opposite side. Also if inequality does not contain an equality sign, then draw a dotted line.
Complete step by step solution:
To solve and graph the given inequality $\dfrac{x}{4} < 9$, we will first
solve it for the value of $x$ as follows
$ \Rightarrow \dfrac{x}{4} < 9$
Multiplying both sides with $4$
$
\Rightarrow 4 \times \dfrac{x}{4} < 4 \times 9 \\
\Rightarrow x < 36 \\
$
We get the required solution, expressing it in interval form, we will get
$x \in ( - \infty ,\;36)$
Now, writing the inequality after as normal equation in order to plot its graph
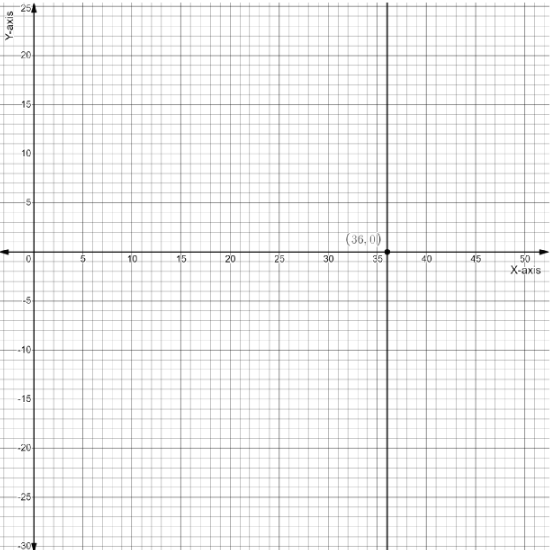
$ \Rightarrow x = 36$
If we plot it in a Cartesian plane, we know that $x = a$ gives a line parallel to y-axis passing from point $(a,\;0)$
So graph of $x = 36$ will be drawn as follows
Now, coming to inequality $x < 36$
Checking it for point $(0,\;0)$
$ \Rightarrow 0 < 36$
$(0,\;0)$ holds true for the inequality, therefore we will shade its side and also the inequality do not includes $36$ so we will draw dotted line
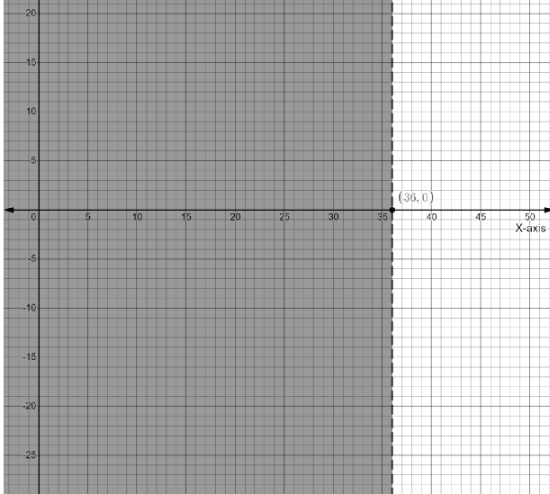
This is the required graph for the given inequality.
Note: When checking for any point, try to check for the origin (given that it does not exist on the graph of the equation), origin is the simplest point you can check for, just put zero in the equation and check if it satisfies the inequality or not.
Complete step by step solution:
To solve and graph the given inequality $\dfrac{x}{4} < 9$, we will first
solve it for the value of $x$ as follows
$ \Rightarrow \dfrac{x}{4} < 9$
Multiplying both sides with $4$
$
\Rightarrow 4 \times \dfrac{x}{4} < 4 \times 9 \\
\Rightarrow x < 36 \\
$
We get the required solution, expressing it in interval form, we will get
$x \in ( - \infty ,\;36)$
Now, writing the inequality after as normal equation in order to plot its graph
$ \Rightarrow x = 36$
If we plot it in a Cartesian plane, we know that $x = a$ gives a line parallel to y-axis passing from point $(a,\;0)$
So graph of $x = 36$ will be drawn as follows
Now, coming to inequality $x < 36$
Checking it for point $(0,\;0)$
$ \Rightarrow 0 < 36$
$(0,\;0)$ holds true for the inequality, therefore we will shade its side and also the inequality do not includes $36$ so we will draw dotted line
This is the required graph for the given inequality.
Note: When checking for any point, try to check for the origin (given that it does not exist on the graph of the equation), origin is the simplest point you can check for, just put zero in the equation and check if it satisfies the inequality or not.
Recently Updated Pages
Master Class 10 Computer Science: Engaging Questions & Answers for Success
Master Class 10 General Knowledge: Engaging Questions & Answers for Success
Master Class 10 English: Engaging Questions & Answers for Success
Master Class 10 Social Science: Engaging Questions & Answers for Success
Master Class 10 Maths: Engaging Questions & Answers for Success
Master Class 10 Science: Engaging Questions & Answers for Success
Trending doubts
What is the median of the first 10 natural numbers class 10 maths CBSE
Which women's tennis player has 24 Grand Slam singles titles?
Who is the Brand Ambassador of Incredible India?
Why is there a time difference of about 5 hours between class 10 social science CBSE
Write a letter to the principal requesting him to grant class 10 english CBSE
State and prove converse of BPT Basic Proportionality class 10 maths CBSE