


How do you sketch the graph of $ y = \sqrt {x + 3} $ and how does it compare to the parent function ?
Answer
557.4k+ views
Hint: A graph of a function f is the set of ordered pairs; the equation of graph is generally represented as $ y = f\left( x \right) $ , where x and $ f\left( x \right) $ are real numbers. We substitute the value of x and we determine the value of y and then we mark the points in the graph and we join the points. The graph for the function $ y = \sqrt {x + 3} $ can be plotted by using the graphical transformations.
Complete step by step solution:
Here, in the given question, we have to plot the graph for the given function. A graph of a function is a set of ordered pairs and it is represented as $ y = f\left( x \right) $ , where x and $ f\left( x \right) $ are real numbers. These pairs are in the form of cartesian form and the graph is the two-dimensional graph.
First, we have to find the value of y by using the graph equation $ y = \sqrt {x + 3} $ .
Let us substitute the value of x as $ 1 $ .
$ \Rightarrow y = \sqrt {1 + 3} $
$ \Rightarrow y = \sqrt 4 $
$ \Rightarrow y = 2 $
Now we consider the value of x as $ 6 $ , the value of y is
$ \Rightarrow y = \sqrt {6 + 3} $
$ \Rightarrow y = \sqrt 9 $
$ \Rightarrow y = 3 $
Now we consider the value of x as $ \left( { - 2} \right) $ , the value of y is
$ \Rightarrow y = \sqrt { - 2 + 3} $
$ \Rightarrow y = \sqrt 1 $
$ \Rightarrow y = 1 $
Now we draw a table for these values we have
We also know the nature of the graph of square root function. Hence, we can now plot the graph of the given function $ y = \sqrt {x + 3} $ . The graph of the function $ y = \sqrt {x + 3} $ can also be plotted using the graphical transformation. We know that the graph of $ y = \sqrt x $ represents a parabola facing rightwards.
So, $ y = \sqrt {x + 3} $ also represents a parabola facing rightwards with a slight change in vertex of the parabola. So, in comparison to the parent function $ y = \sqrt x $ , there is just a change in the vertex of the parabola.
The graph plotted for these points is represented below:
Note: The graphical transformations of the functions help us to easily plot graphs of complex and derived functions using the nature of the graphs of parent functions. Functions are plotted with the help of coordinates of the points lying on it.
Complete step by step solution:
Here, in the given question, we have to plot the graph for the given function. A graph of a function is a set of ordered pairs and it is represented as $ y = f\left( x \right) $ , where x and $ f\left( x \right) $ are real numbers. These pairs are in the form of cartesian form and the graph is the two-dimensional graph.
First, we have to find the value of y by using the graph equation $ y = \sqrt {x + 3} $ .
Let us substitute the value of x as $ 1 $ .
$ \Rightarrow y = \sqrt {1 + 3} $
$ \Rightarrow y = \sqrt 4 $
$ \Rightarrow y = 2 $
Now we consider the value of x as $ 6 $ , the value of y is
$ \Rightarrow y = \sqrt {6 + 3} $
$ \Rightarrow y = \sqrt 9 $
$ \Rightarrow y = 3 $
Now we consider the value of x as $ \left( { - 2} \right) $ , the value of y is
$ \Rightarrow y = \sqrt { - 2 + 3} $
$ \Rightarrow y = \sqrt 1 $
$ \Rightarrow y = 1 $
Now we draw a table for these values we have
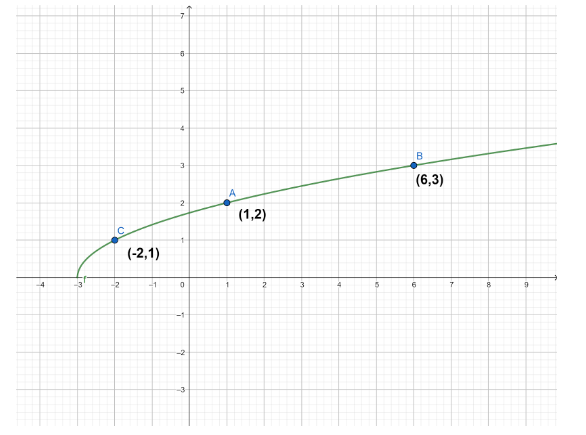
| x | $ 1 $ | $ 6 $ | $ \left( { - 2} \right) $ |
| y | $ 2 $ | $ 3 $ | $ 1 $ |
We also know the nature of the graph of square root function. Hence, we can now plot the graph of the given function $ y = \sqrt {x + 3} $ . The graph of the function $ y = \sqrt {x + 3} $ can also be plotted using the graphical transformation. We know that the graph of $ y = \sqrt x $ represents a parabola facing rightwards.
So, $ y = \sqrt {x + 3} $ also represents a parabola facing rightwards with a slight change in vertex of the parabola. So, in comparison to the parent function $ y = \sqrt x $ , there is just a change in the vertex of the parabola.
The graph plotted for these points is represented below:
Note: The graphical transformations of the functions help us to easily plot graphs of complex and derived functions using the nature of the graphs of parent functions. Functions are plotted with the help of coordinates of the points lying on it.
Recently Updated Pages
Master Class 12 Economics: Engaging Questions & Answers for Success
Master Class 12 English: Engaging Questions & Answers for Success
Master Class 12 Social Science: Engaging Questions & Answers for Success
Master Class 12 Maths: Engaging Questions & Answers for Success
Master Class 12 Physics: Engaging Questions & Answers for Success
Master Class 9 General Knowledge: Engaging Questions & Answers for Success
Trending doubts
One Metric ton is equal to kg A 10000 B 1000 C 100 class 11 physics CBSE
Difference Between Prokaryotic Cells and Eukaryotic Cells
Two of the body parts which do not appear in MRI are class 11 biology CBSE
1 ton equals to A 100 kg B 1000 kg C 10 kg D 10000 class 11 physics CBSE
10 examples of friction in our daily life
Name the Largest and the Smallest Cell in the Human Body ?