
Prepare the frequency distribution table for the given set of scores:
39, 16, 30, 37, 53, 15, 16, 60, 58, 26, 28, 19, 20, 12, 14, 24, 59, 21, 57, 38, 25, 36, 24, 15, 25, 41, 52, 45, 60, 63, 18, 26, 43, 36, 18, 27, 59, 63, 46, 42, 48, 35, 64, 24.
Take class interval as (10-20), (20-30) . . . . . . and answer the following:
I. What does the frequency corresponding to the third class interval mean?
II. What is the size of each class interval? Find the midpoint of the class interval 30-40.
III. What is the range of the given set of scores?
Answer
577.2k+ views
Hint: In this question, we are given different sets of scores and we have to make a frequency distribution table for that. For this, we will use class intervals 10-20, 20-30, 30-40, 40-50, 50-60, and 60-70 and use tally marks for calculating the frequency of the intervals. Using the table obtained, we will answer the given three questions. For finding the size of any class interval, we use the formula as given by, Size = Upperclass limit - lower class limit. For finding the midpoint of the class interval, we use the formula given by $\text{Midpoint}=\dfrac{\text{lower class limit}+\text{upper class limit}}{2}$ and for finding the range of the data we have to find the difference between the highest score and least score.
Complete step-by-step solution:
Let us use tally marks for preparing a frequency distribution table having classes as 10-20, 20-30, 30-40, 40-50, 50-60, and 60-70.
We will use 1 for | frequency, || for 2 frequency and similarly |||| for 4. For 5 we will use
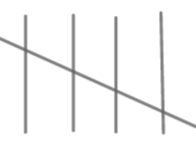 as a set. Similarly
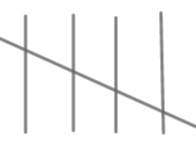
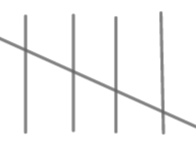 represents 10.
Table becomes:
From this table, now we can answer the question:
I. Here, we have to tell the frequency corresponding to the third class interval. As we can see from the table, the third class is 30-40 and its frequency is 8.
So, the answer to the first part is 8.
II. Here, we have to tell the size of each class interval. Size is defined as the width of any class. Since the width is given by the difference between the upper-class limit and lower class limit. So, the size of the class interval becomes:
Size = upper-class limit - lower class limit.
Since, all classes are of the same size, so considering the class 10-20.
Size = 20-10 = 10.
Hence, the size of every class interval is 10.
Now, we have to find the midpoint of the class 30-40. As we know midpoint of any class is given as
\[\text{Midpoint}=\dfrac{\text{lower class limit}+\text{upper class limit}}{2}\]
So, using this formula for 30-40 class, we get:
\[\text{Midpoint}=\dfrac{30+40}{2}=\dfrac{70}{2}=35\]
Hence, the midpoint of class 30-40 is 35.
III. Here, we have to find a range of data. We know, the range is the difference between the highest number and least number from data, we can see that, highest number = 64 and least number = 12. Hence, the range becomes
Range = 64-12 = 52.
Hence, the range of given data is 52.
Note: Students should always use tally marks for such large data while making a frequency distribution table. Students should note that, while finding a range they should find the highest and least number from data only and not from the class limit in the frequency distribution table. While finding the size of the class interval, they can consider any class for calculation as all classes have the same width.
Complete step-by-step solution:
Let us use tally marks for preparing a frequency distribution table having classes as 10-20, 20-30, 30-40, 40-50, 50-60, and 60-70.
We will use 1 for | frequency, || for 2 frequency and similarly |||| for 4. For 5 we will use


Table becomes:
| Class Interval | Tally Marks | Frequency |
| 10-20 | 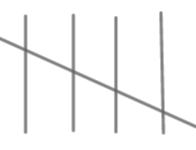
| 9 |
| 20-30 | 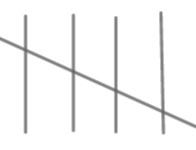
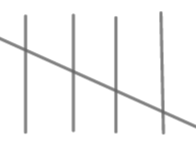
| 12 |
| 30-40 | 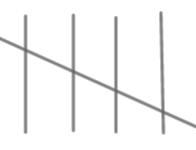
| 8 |
| 40-50 | 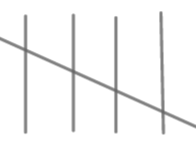
| 7 |
| 50-60 | 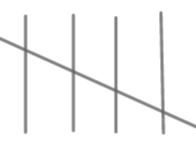
| 6 |
| 60-70 | 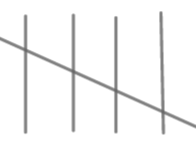
| 5 |
From this table, now we can answer the question:
I. Here, we have to tell the frequency corresponding to the third class interval. As we can see from the table, the third class is 30-40 and its frequency is 8.
So, the answer to the first part is 8.
II. Here, we have to tell the size of each class interval. Size is defined as the width of any class. Since the width is given by the difference between the upper-class limit and lower class limit. So, the size of the class interval becomes:
Size = upper-class limit - lower class limit.
Since, all classes are of the same size, so considering the class 10-20.
Size = 20-10 = 10.
Hence, the size of every class interval is 10.
Now, we have to find the midpoint of the class 30-40. As we know midpoint of any class is given as
\[\text{Midpoint}=\dfrac{\text{lower class limit}+\text{upper class limit}}{2}\]
So, using this formula for 30-40 class, we get:
\[\text{Midpoint}=\dfrac{30+40}{2}=\dfrac{70}{2}=35\]
Hence, the midpoint of class 30-40 is 35.
III. Here, we have to find a range of data. We know, the range is the difference between the highest number and least number from data, we can see that, highest number = 64 and least number = 12. Hence, the range becomes
Range = 64-12 = 52.
Hence, the range of given data is 52.
Note: Students should always use tally marks for such large data while making a frequency distribution table. Students should note that, while finding a range they should find the highest and least number from data only and not from the class limit in the frequency distribution table. While finding the size of the class interval, they can consider any class for calculation as all classes have the same width.
Recently Updated Pages
Master Class 10 Computer Science: Engaging Questions & Answers for Success

Master Class 10 General Knowledge: Engaging Questions & Answers for Success

Master Class 10 English: Engaging Questions & Answers for Success

Master Class 10 Social Science: Engaging Questions & Answers for Success

Master Class 10 Maths: Engaging Questions & Answers for Success

Master Class 10 Science: Engaging Questions & Answers for Success

Trending doubts
What is the median of the first 10 natural numbers class 10 maths CBSE

Which women's tennis player has 24 Grand Slam singles titles?

Who is the Brand Ambassador of Incredible India?

Why is there a time difference of about 5 hours between class 10 social science CBSE

Write a letter to the principal requesting him to grant class 10 english CBSE

State and prove converse of BPT Basic Proportionality class 10 maths CBSE


