


How do you plot the points (4,1),(-2,3),(3,0) on the coordinate plane?
Answer
562.5k+ views
Hint: Plot a table first and make two columns and 5 rows. Now for every value of x starting from -2, try to get the value of y. After getting all the points, tabulate them and then graph each point on the graph. After doing this, connect all the lines to get the graph you need.
Complete step by step solution:
In order to draw the graph of the given values the first thing we will need to do is draw a table where we will note down respective values of x and y given to us
Now we will point each point on the graph
Scale of our graph is horizontal line = X axis. Vertical line=Y axis. And 1 block is of 0.5 unit x axis and 0.5 unit on y axis.
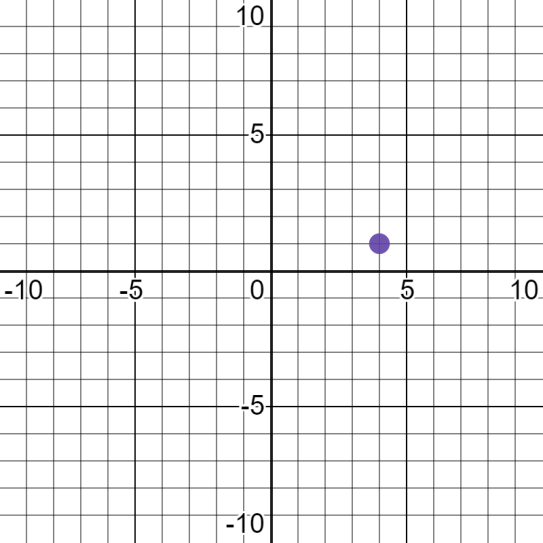
So let’s start with the first one where
x=4 and y=1
This means the point will be 4 points away from y axis and 1 units away from x axis
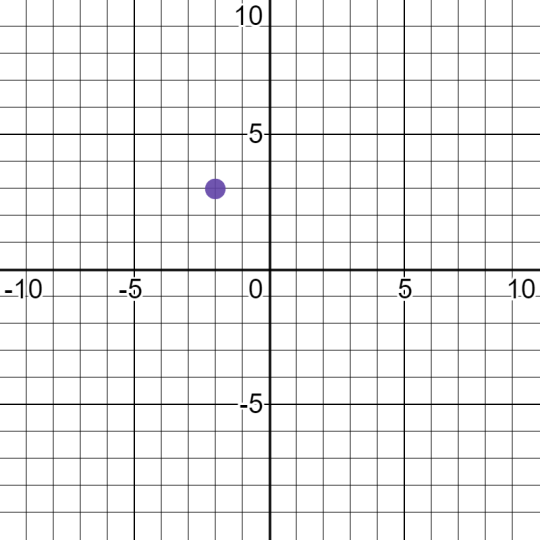
Now, we will graph the second point
Where x=-2 and y=3
This means the point will be -2 points away from y axis and 3 units away from x axis
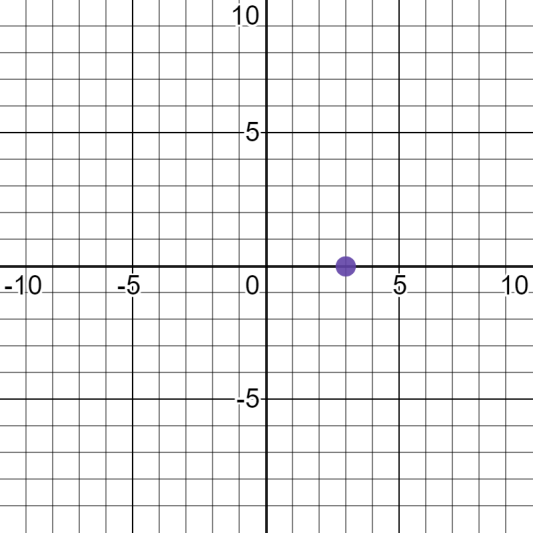
Now, we will graph the third point where
Where x=3 and y=0
This means the point will be 3 points away from y axis and 0 units away from x axis
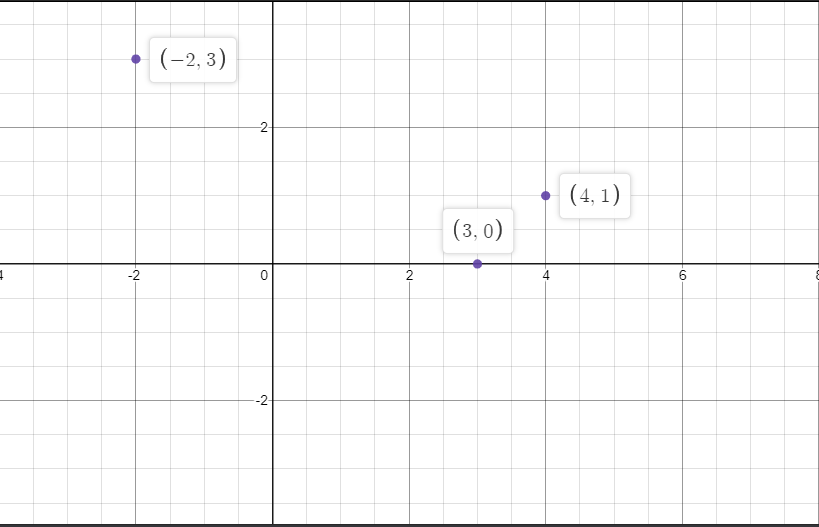
Now, if you want to see all the points together
It will look something like this:-
Note: Don't exchange the values of x or y. because the x value is for distance of a point from y axis and y value is for distance of a point from x axis. So (2,3) and (3,2) are totally different points. The distance from the axis and the value of the coordinate are of opposite signs ( X and Y ).
Complete step by step solution:
In order to draw the graph of the given values the first thing we will need to do is draw a table where we will note down respective values of x and y given to us
| x | Y |
| 4 | 1 |
| -2 | 3 |
| 3 | 0 |
Now we will point each point on the graph
Scale of our graph is horizontal line = X axis. Vertical line=Y axis. And 1 block is of 0.5 unit x axis and 0.5 unit on y axis.
So let’s start with the first one where
x=4 and y=1
This means the point will be 4 points away from y axis and 1 units away from x axis
Now, we will graph the second point
Where x=-2 and y=3
This means the point will be -2 points away from y axis and 3 units away from x axis
Now, we will graph the third point where
Where x=3 and y=0
This means the point will be 3 points away from y axis and 0 units away from x axis
Now, if you want to see all the points together
It will look something like this:-
Note: Don't exchange the values of x or y. because the x value is for distance of a point from y axis and y value is for distance of a point from x axis. So (2,3) and (3,2) are totally different points. The distance from the axis and the value of the coordinate are of opposite signs ( X and Y ).
Recently Updated Pages
Master Class 11 Social Science: Engaging Questions & Answers for Success
Master Class 11 Physics: Engaging Questions & Answers for Success
Master Class 11 Maths: Engaging Questions & Answers for Success
Master Class 11 Economics: Engaging Questions & Answers for Success
Master Class 11 Computer Science: Engaging Questions & Answers for Success
Master Class 11 Chemistry: Engaging Questions & Answers for Success
Trending doubts
One Metric ton is equal to kg A 10000 B 1000 C 100 class 11 physics CBSE
How many bones are in the spine class 11 biology CBSE
1 Quintal is equal to a 110 kg b 10 kg c 100kg d 1000 class 11 physics CBSE
There are 720 permutations of the digits 1 2 3 4 5 class 11 maths CBSE
State and prove Bernoullis theorem class 11 physics CBSE
Difference Between Prokaryotic Cells and Eukaryotic Cells