


How do you plot the point \[X(1,10)\] on a coordinate plane
Answer
583.5k+ views
Hint: Here in this question we have to plot the graph for the given points. Here we have a value of x axis and y axis. They have given only one value of x and y. Hence by considering the points we plot the graph for the given question. hence the solution is obtained for the given question.
Complete step-by-step solution:
Here in this question, we have to plot the graph for the given function. A graph of a function is a set of ordered pairs and it is represented as \[y = f(x)\], where x and f(x) are real numbers. These pairs are in the form of cartesian form and the graph is the two-dimensional graph.
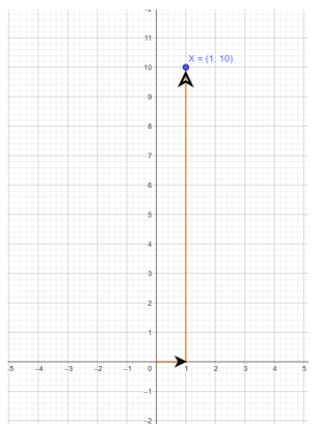
Here we have a point, usually the point is generally represented as \[(x,y)\]. The first term represents the x value and the second term represents the y value. Here we have to plot the graph for the point \[(1,10)\]. Here when the x value is 1, then the value of y is 10. The line of a graph will be parallel to the y axis.
From the origin of a graph we have to move 1 step right side and then 10 steps upwards for the point (1, 10).
Therefore the graph for the points is plotted as shown below:
Note: The graph is plotted x-axis versus y axis. The graph is two dimensional. By the equation of a graph, we can plot the graph by assuming the value of x. We can’t assume the value of y. because the value of y depends on the value of x. Hence, we have plotted the graph.
Complete step-by-step solution:
Here in this question, we have to plot the graph for the given function. A graph of a function is a set of ordered pairs and it is represented as \[y = f(x)\], where x and f(x) are real numbers. These pairs are in the form of cartesian form and the graph is the two-dimensional graph.
Here we have a point, usually the point is generally represented as \[(x,y)\]. The first term represents the x value and the second term represents the y value. Here we have to plot the graph for the point \[(1,10)\]. Here when the x value is 1, then the value of y is 10. The line of a graph will be parallel to the y axis.
From the origin of a graph we have to move 1 step right side and then 10 steps upwards for the point (1, 10).
Therefore the graph for the points is plotted as shown below:
Note: The graph is plotted x-axis versus y axis. The graph is two dimensional. By the equation of a graph, we can plot the graph by assuming the value of x. We can’t assume the value of y. because the value of y depends on the value of x. Hence, we have plotted the graph.
Recently Updated Pages
Master Class 11 English: Engaging Questions & Answers for Success
Master Class 11 Social Science: Engaging Questions & Answers for Success
Master Class 11 Maths: Engaging Questions & Answers for Success
Master Class 11 Biology: Engaging Questions & Answers for Success
Master Class 11 Physics: Engaging Questions & Answers for Success
Master Class 11 Chemistry: Engaging Questions & Answers for Success
Trending doubts
One Metric ton is equal to kg A 10000 B 1000 C 100 class 11 physics CBSE
Difference Between Prokaryotic Cells and Eukaryotic Cells
1 ton equals to A 100 kg B 1000 kg C 10 kg D 10000 class 11 physics CBSE
Find the value of the expression given below sin 30circ class 11 maths CBSE
Two of the body parts which do not appear in MRI are class 11 biology CBSE
What are hard magnetic materials class 11 physics CBSE