


How do you plot the point \[(4,270\,\,\, degrees)\]
Answer
576.9k+ views
Hint: Here in this question we have to plot the graph for the given points. Here we have the points in the polar form; we have converted it into Cartesian form. Hence by considering the points we plot the graph for the given question. hence the solution is obtained for the given question.
Complete step-by-step solution:
Here in this question, we have to plot the graph for the given function. A graph of a function is a set of ordered pairs and it is represented as \[y = f(x)\], where x and f(x) are real numbers. These pairs are in the form of cartesian form and the graph is the two-dimensional graph.
Here the given point is in the form of polar form. The general polar form is represented as \[(r,\theta )\]
While converting the polar form into cartesian form \[x = r\cos \theta \] and \[y = r\sin \theta \]. Here the value of r is 4 and \[\theta \] is \[{270^ \circ }\].
Therefore the value of x and y is determined by
\[x = 4\cos \left( {{{270}^ \circ }} \right)\]
The value of \[\cos (270)\] is 0. Therefore the value of x is
\[
\Rightarrow x = 4.(0) \\
\Rightarrow x = 0 \\
\]
The value of y is
\[y = 4\sin \left( {{{270}^ \circ }} \right)\]
The value of \[\sin (270)\] is -1. Therefore the value of x is
\[
\Rightarrow y = 4.( - 1) \\
\Rightarrow y = - 4 \\
\]
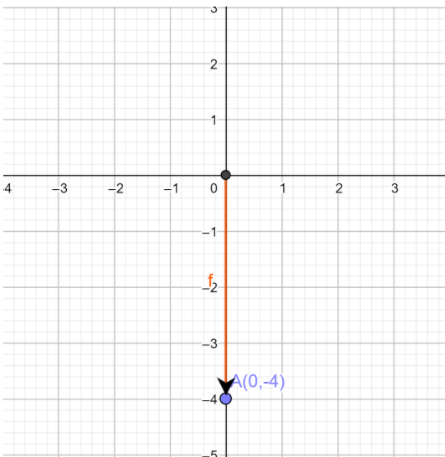
Here we have a point, usually the point is generally represented as \[(x,y)\]. The first term represents the x value and the second term represents the y value. Here we have to plot the graph for the point \[(0, - 4)\]. Here when the x value is 0, then the value of y is -4. The point will be on the y axis.
From the origin of a graph we have to move 4 steps downwards for the point (0, -4).
Therefore the graph for the points is plotted as shown below:
Note: The graph is plotted x-axis versus y axis. The graph is two dimensional. By the equation of a graph, we can plot the graph by assuming the value of x. We can’t assume the value of y. because the value of y depends on the value of x. Hence, we have plotted the graph.
Complete step-by-step solution:
Here in this question, we have to plot the graph for the given function. A graph of a function is a set of ordered pairs and it is represented as \[y = f(x)\], where x and f(x) are real numbers. These pairs are in the form of cartesian form and the graph is the two-dimensional graph.
Here the given point is in the form of polar form. The general polar form is represented as \[(r,\theta )\]
While converting the polar form into cartesian form \[x = r\cos \theta \] and \[y = r\sin \theta \]. Here the value of r is 4 and \[\theta \] is \[{270^ \circ }\].
Therefore the value of x and y is determined by
\[x = 4\cos \left( {{{270}^ \circ }} \right)\]
The value of \[\cos (270)\] is 0. Therefore the value of x is
\[
\Rightarrow x = 4.(0) \\
\Rightarrow x = 0 \\
\]
The value of y is
\[y = 4\sin \left( {{{270}^ \circ }} \right)\]
The value of \[\sin (270)\] is -1. Therefore the value of x is
\[
\Rightarrow y = 4.( - 1) \\
\Rightarrow y = - 4 \\
\]
Here we have a point, usually the point is generally represented as \[(x,y)\]. The first term represents the x value and the second term represents the y value. Here we have to plot the graph for the point \[(0, - 4)\]. Here when the x value is 0, then the value of y is -4. The point will be on the y axis.
From the origin of a graph we have to move 4 steps downwards for the point (0, -4).
Therefore the graph for the points is plotted as shown below:
Note: The graph is plotted x-axis versus y axis. The graph is two dimensional. By the equation of a graph, we can plot the graph by assuming the value of x. We can’t assume the value of y. because the value of y depends on the value of x. Hence, we have plotted the graph.
Recently Updated Pages
Master Class 12 Economics: Engaging Questions & Answers for Success
Master Class 12 English: Engaging Questions & Answers for Success
Master Class 12 Social Science: Engaging Questions & Answers for Success
Master Class 12 Maths: Engaging Questions & Answers for Success
Master Class 12 Physics: Engaging Questions & Answers for Success
Master Class 9 General Knowledge: Engaging Questions & Answers for Success
Trending doubts
One Metric ton is equal to kg A 10000 B 1000 C 100 class 11 physics CBSE
Difference Between Prokaryotic Cells and Eukaryotic Cells
Two of the body parts which do not appear in MRI are class 11 biology CBSE
1 ton equals to A 100 kg B 1000 kg C 10 kg D 10000 class 11 physics CBSE
Draw a diagram of nephron and explain its structur class 11 biology CBSE
10 examples of friction in our daily life