


How do you plot the graph of the equation $y = 3x - 4$ ?
Answer
579.3k+ views
Hint: Try to draw it on a graph paper, and keep the scale $1$ or $2$. Find some values for $x$ and $y$ by putting random values of one of them in the given equation, so that you will get the value of the other one. Do not take larger random values, go for values like $0,\;1,\;2,$ etc.
Complete answer:
Now, firstly we have to find some values of $x$ and $y$, we will put some values of $x$ in the equation and then get respective values of $y$ For this we will create a table in which we will write the values of $x$ and $y$, creating the table below.
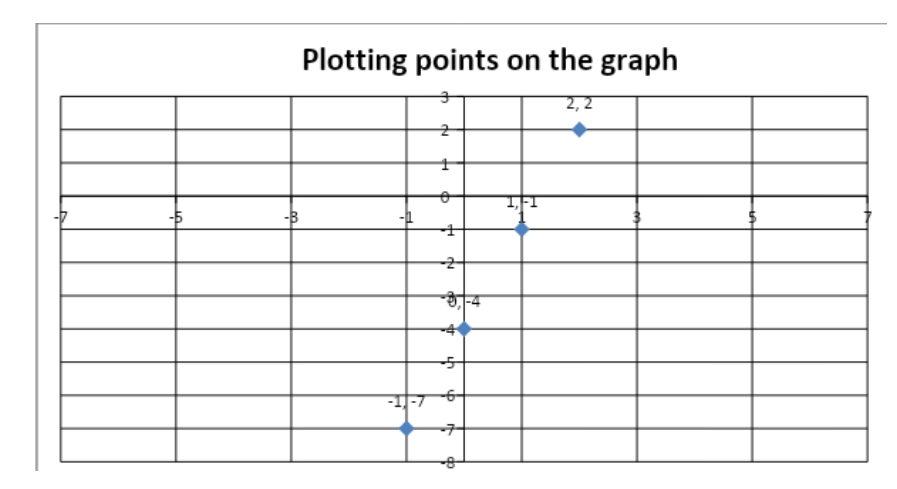
Now, you can see in the table, how we have calculated the value of $y$ by putting random values of $x$ in the above equation. Now, we have the three coordinates of the required graph, i.e.$(0,\; - 4),\;(1,\; - 1),\;( - 1,\; - 7)$ and $(2,\;2)$. So, we will now plot these three points on the graph.
So, we have plotted all the points on the graph, now we have to draw a line passing through these points. So let’s draw the line,
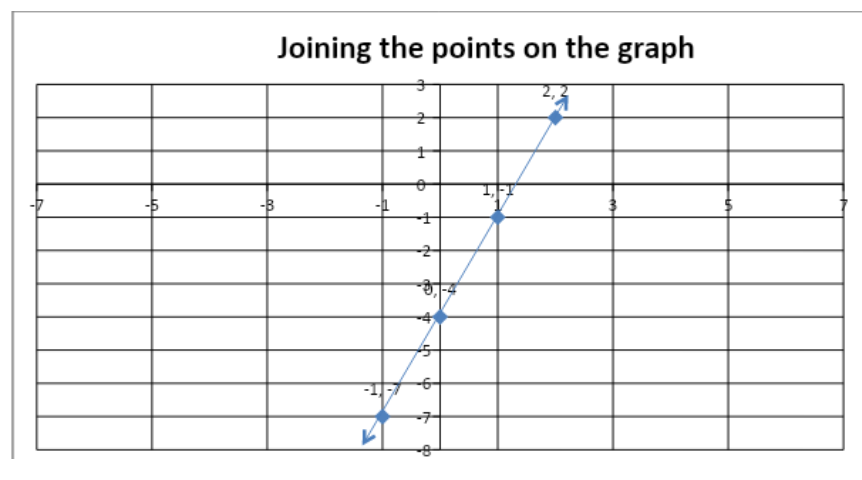
Here we get the required graph of the equation $y = 3x - 4$, you should also try this method for another type of equation.
Note: Always try to get smaller numbers so that you can easily plot the graph of the given equation. But, if you are getting larger values $x$ and $y$ from the equation itself, then you should take larger values of the scale on the graph.
Complete answer:
Now, firstly we have to find some values of $x$ and $y$, we will put some values of $x$ in the equation and then get respective values of $y$ For this we will create a table in which we will write the values of $x$ and $y$, creating the table below.
| Random values of $x$ | Value of $y = 3x - 4$ |
| $0$ | $y = 3 \times 0 - 4 = 0 - 4 = - 4$ |
| $1$ | $y = 3 \times 1 - 4 = 3 - 4 = - 1$ |
| $ - 1$ | $y = 3 \times ( - 1) - 4 = - 3 - 4 = - 7$ |
| $2$ | $y = 3 \times 2 - 4 = 6 - 4 = 2$ |
Now, you can see in the table, how we have calculated the value of $y$ by putting random values of $x$ in the above equation. Now, we have the three coordinates of the required graph, i.e.$(0,\; - 4),\;(1,\; - 1),\;( - 1,\; - 7)$ and $(2,\;2)$. So, we will now plot these three points on the graph.
So, we have plotted all the points on the graph, now we have to draw a line passing through these points. So let’s draw the line,
Here we get the required graph of the equation $y = 3x - 4$, you should also try this method for another type of equation.
Note: Always try to get smaller numbers so that you can easily plot the graph of the given equation. But, if you are getting larger values $x$ and $y$ from the equation itself, then you should take larger values of the scale on the graph.
Recently Updated Pages
Master Class 11 Social Science: Engaging Questions & Answers for Success
Master Class 11 Physics: Engaging Questions & Answers for Success
Master Class 11 Maths: Engaging Questions & Answers for Success
Master Class 11 Economics: Engaging Questions & Answers for Success
Master Class 11 Computer Science: Engaging Questions & Answers for Success
Master Class 11 Chemistry: Engaging Questions & Answers for Success
Trending doubts
One Metric ton is equal to kg A 10000 B 1000 C 100 class 11 physics CBSE
There are 720 permutations of the digits 1 2 3 4 5 class 11 maths CBSE
1 Quintal is equal to a 110 kg b 10 kg c 100kg d 1000 class 11 physics CBSE
State and prove Bernoullis theorem class 11 physics CBSE
Difference Between Prokaryotic Cells and Eukaryotic Cells
Which among the following are examples of coming together class 11 social science CBSE