


Plot the graph and list the amplitude, period, phase shift for the given equation,
y=−sin(πx+1) −2?
Answer
573.6k+ views
Hint:To find the amplitude, time period and the phase shift, compare the given equation to the standard “sine” wave equation. After comparing, put the values in the respective formulas to get the final answers. While plotting the graphs all these data that you have solved will help in easier plotting.
Complete step by step solution:
The standard sine equation looks like,
Y = A sin (Bx + C) +D
Where,
Amplitude = |A|
The period, τ =2π|B|
The phase shift, ϕ =$ - \dfrac{C}{B}$
Comparing the given question y=−sin(πx+1) −2 to a standard sine equation,
we have,
Amplitude = |A| = |-1| = 1
The period, τ =$\dfrac{{2\pi }}{{|B|}}$ = $\dfrac{{2\pi }}{\pi }$= 2
The phase shift, ϕ =$ - \dfrac{C}{B}$= $ - \dfrac{1}{\pi }$
Now, we can draw the graph that would look like the following:
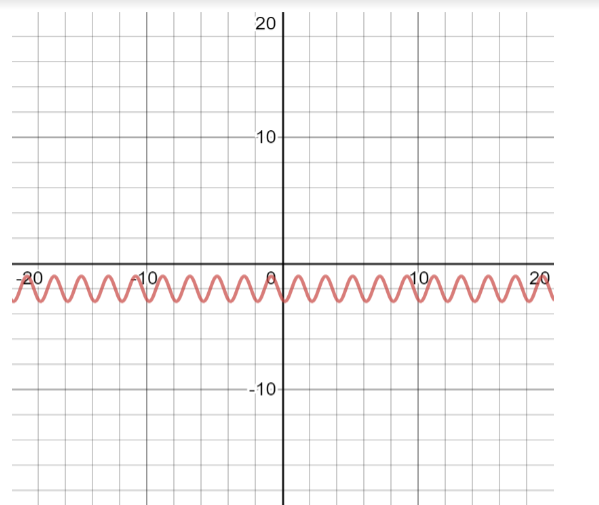
You can see that the negative sign in the beginning of the expression on the right-hand side implies
that the sinusoidal curve is the negative part of the y – axis. The negative constant of “-2” in the RHS implies that the curve shifts further below by 2 units.
Note: It is advisable to always find out the amplitude and time period first, before plotting the graph. This helps in plotting the graph with more clarity. Sinusoidal curves also have time periods, which decide the width of each crest and trough of the graph.
Complete step by step solution:
The standard sine equation looks like,
Y = A sin (Bx + C) +D
Where,
Amplitude = |A|
The period, τ =2π|B|
The phase shift, ϕ =$ - \dfrac{C}{B}$
Comparing the given question y=−sin(πx+1) −2 to a standard sine equation,
we have,
Amplitude = |A| = |-1| = 1
The period, τ =$\dfrac{{2\pi }}{{|B|}}$ = $\dfrac{{2\pi }}{\pi }$= 2
The phase shift, ϕ =$ - \dfrac{C}{B}$= $ - \dfrac{1}{\pi }$
Now, we can draw the graph that would look like the following:
You can see that the negative sign in the beginning of the expression on the right-hand side implies
that the sinusoidal curve is the negative part of the y – axis. The negative constant of “-2” in the RHS implies that the curve shifts further below by 2 units.
Note: It is advisable to always find out the amplitude and time period first, before plotting the graph. This helps in plotting the graph with more clarity. Sinusoidal curves also have time periods, which decide the width of each crest and trough of the graph.
Recently Updated Pages
Master Class 11 Social Science: Engaging Questions & Answers for Success
Master Class 11 Physics: Engaging Questions & Answers for Success
Master Class 11 Maths: Engaging Questions & Answers for Success
Master Class 11 Economics: Engaging Questions & Answers for Success
Master Class 11 Computer Science: Engaging Questions & Answers for Success
Master Class 11 Chemistry: Engaging Questions & Answers for Success
Trending doubts
One Metric ton is equal to kg A 10000 B 1000 C 100 class 11 physics CBSE
How many bones are in the spine class 11 biology CBSE
There are 720 permutations of the digits 1 2 3 4 5 class 11 maths CBSE
What is charge mass and charge to mass ratio of an class 11 chemistry CBSE
State and prove Bernoullis theorem class 11 physics CBSE
Difference Between Prokaryotic Cells and Eukaryotic Cells