


How do you plot the function $y=-2x+1$ on a graph?
Answer
581.4k+ views
Hint:
We start solving the problem by recalling the fact that we need at least two points to draw a line. We then find the point at which the given line intersects the y-axis by using the fact that the value of x-coordinate on the y-axis is zero. We then find the point at which the given line intersects the x-axis by using the fact that the value of y-coordinate on the x-axis is zero. We then represent these two points on the plot and then join those points to get the required plot.
Complete step by step answer:
According to the problem, we are asked to plot the given function $y=-2x+1$ on a graph.
We can see that the given equation $y=-2x+1$ resembles the slope form of the equation of the line $y=mx+c$.
We know that in order to draw a line, we at least need two points. So, let us find the points at which the given line intersects the x-axis and y-axis.
Now, let us find the point at which the line intersects y-axis. We know that the value of the x-coordinate on the y-axis is zero. Let us substitute $x=0$ in the given equation to find the intersection point.
So, we get $y=-2\left( 0 \right)+1$.
$\Rightarrow y=0+1$.
$\Rightarrow y=1$.
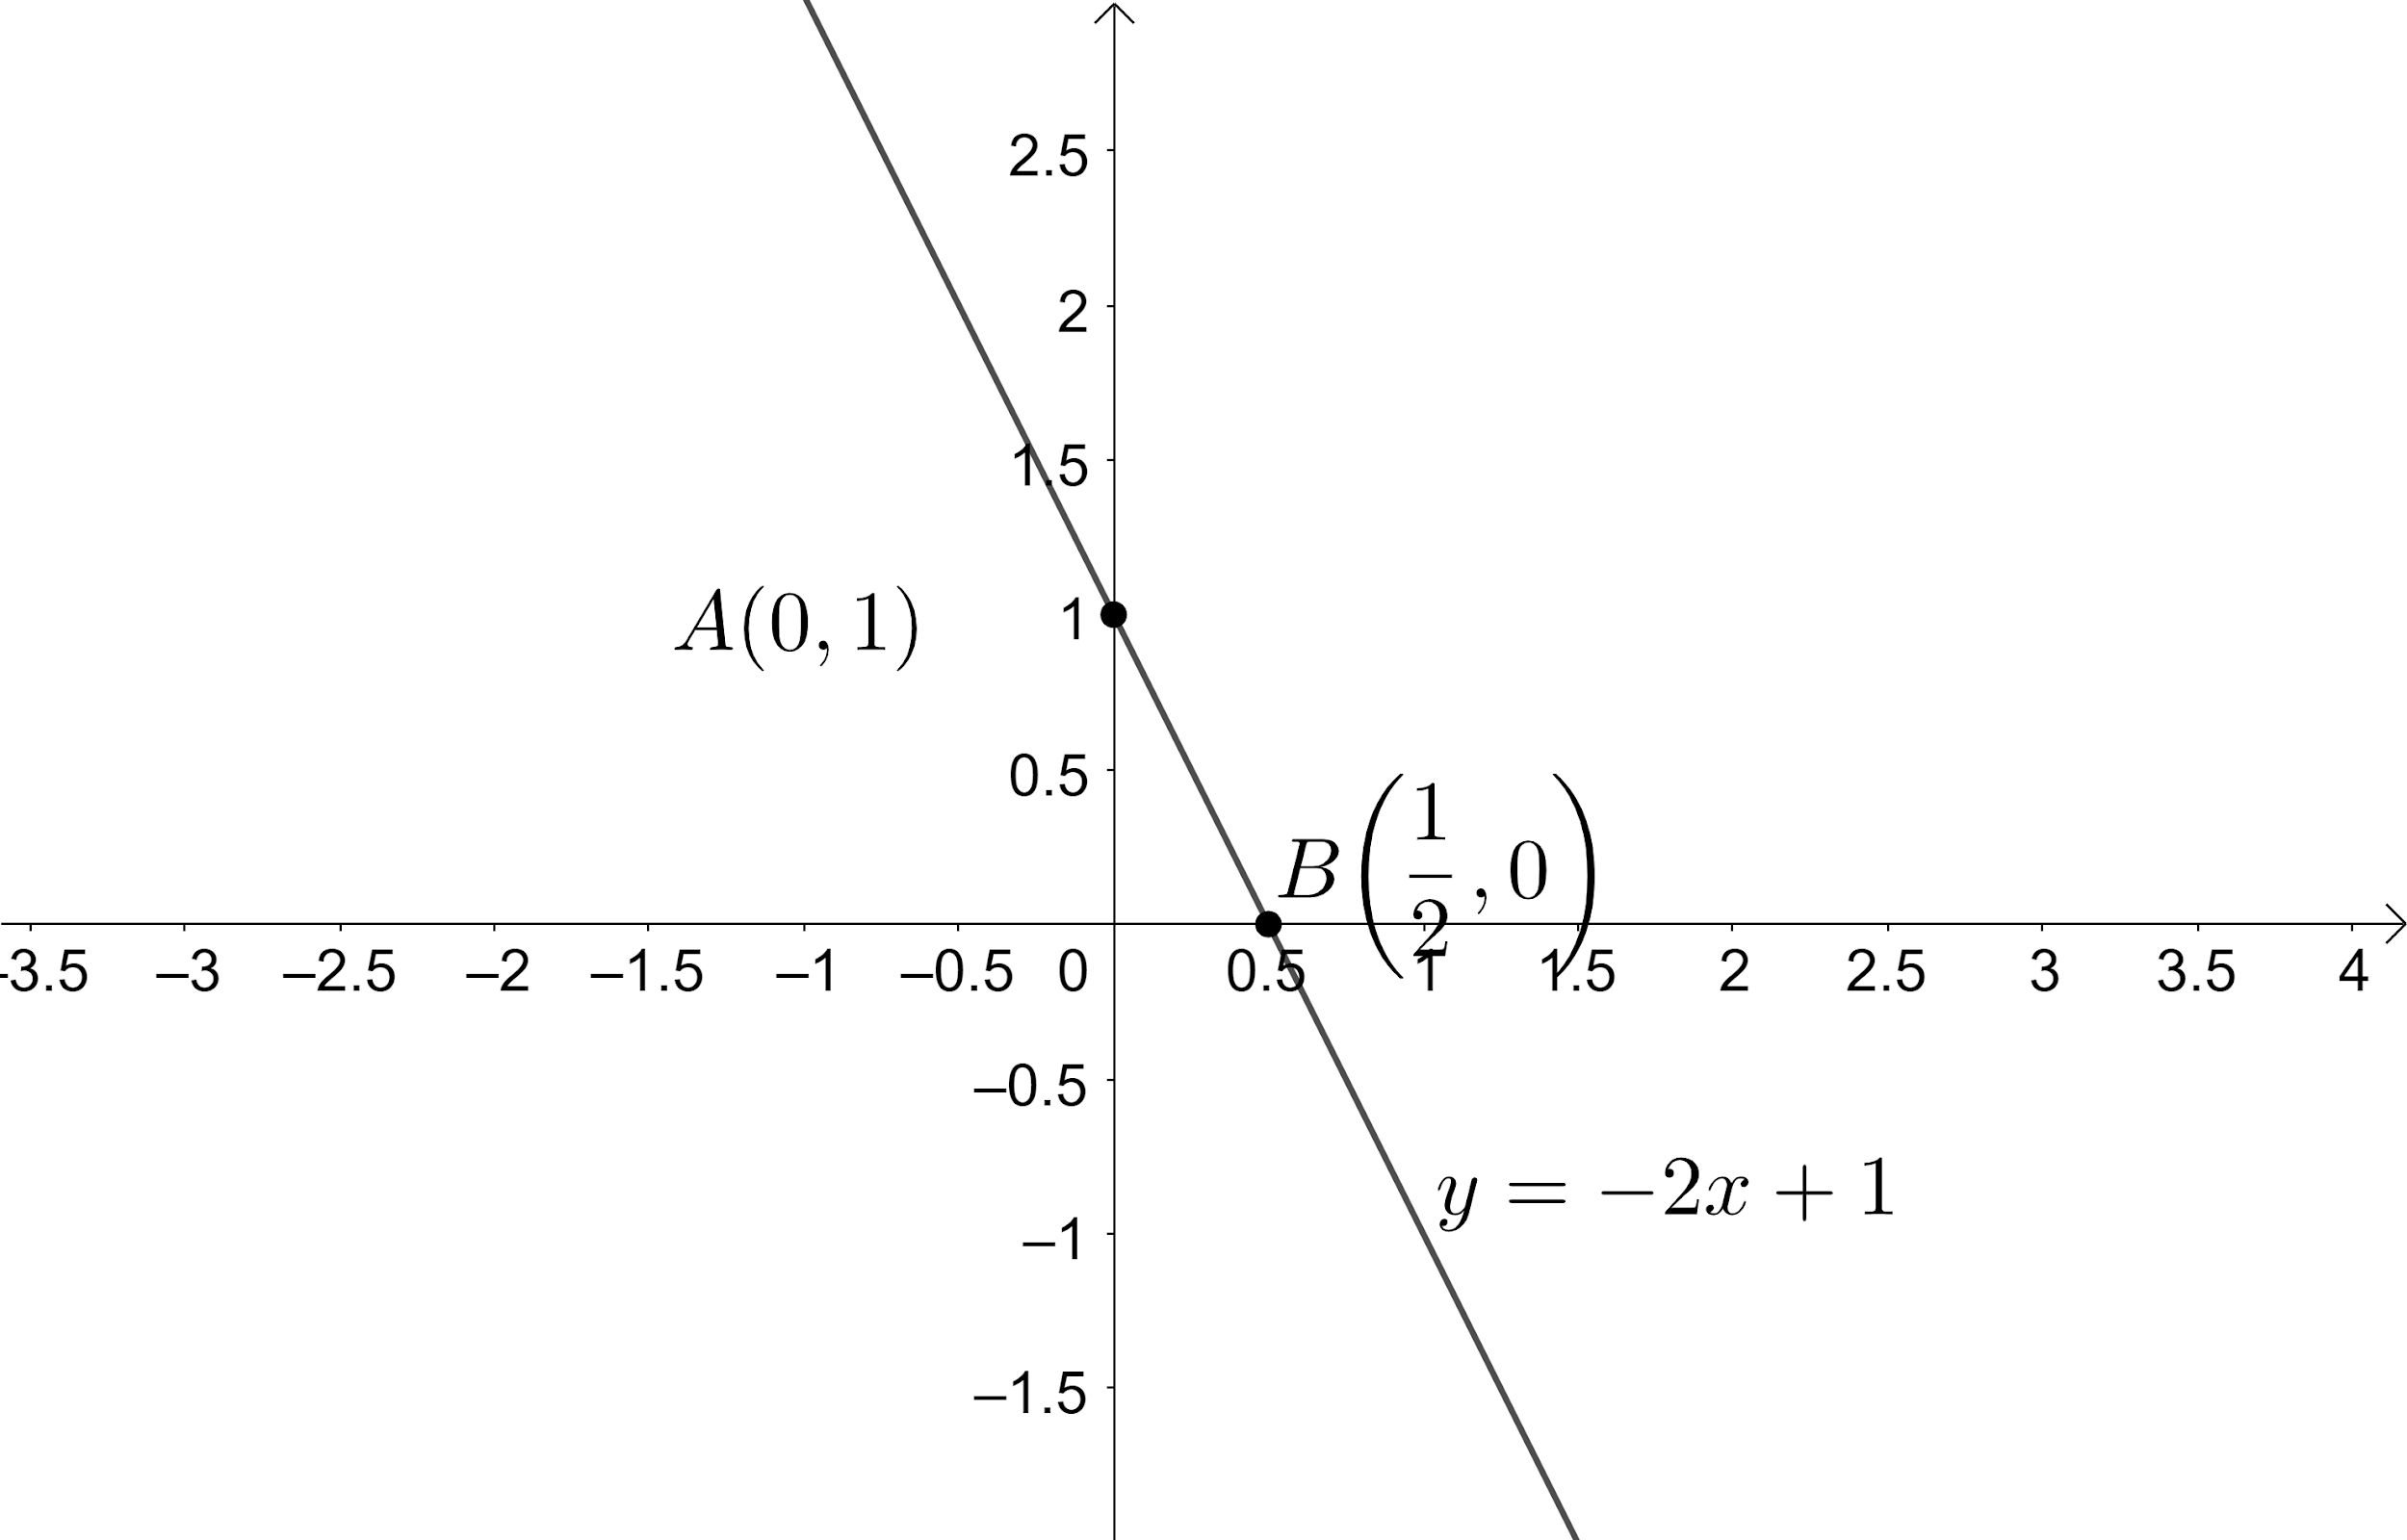
So, the intersection point of the line $y=-2x+1$ with y-axis is $A\left( 0,1 \right)$.
Now, let us find the point at which the line intersects x-axis. We know that the value of the y-coordinate on the x-axis is zero. Let us substitute $y=0$ in the given equation to find the intersection point.
So, we get $0=-2x+1$.
$\Rightarrow 2x=1$.
$\Rightarrow x=\dfrac{1}{2}$.
So, the intersection point of the line $y=-2x+1$ with x-axis is $B\left( \dfrac{1}{2},0 \right)$.
Now, let us plot the given line by representing and joining the obtained two points on the graph which is as shown below:
Note:
Whenever we get this type of problem, we first try to find the points at which the given curve intersects both the axes. We can also plot the given equation by assuming the values for x to find the points which will help to plot on the graph. Similarly, we can expect problems to plot the function of $3y=4x+5$ on the graph.
We start solving the problem by recalling the fact that we need at least two points to draw a line. We then find the point at which the given line intersects the y-axis by using the fact that the value of x-coordinate on the y-axis is zero. We then find the point at which the given line intersects the x-axis by using the fact that the value of y-coordinate on the x-axis is zero. We then represent these two points on the plot and then join those points to get the required plot.
Complete step by step answer:
According to the problem, we are asked to plot the given function $y=-2x+1$ on a graph.
We can see that the given equation $y=-2x+1$ resembles the slope form of the equation of the line $y=mx+c$.
We know that in order to draw a line, we at least need two points. So, let us find the points at which the given line intersects the x-axis and y-axis.
Now, let us find the point at which the line intersects y-axis. We know that the value of the x-coordinate on the y-axis is zero. Let us substitute $x=0$ in the given equation to find the intersection point.
So, we get $y=-2\left( 0 \right)+1$.
$\Rightarrow y=0+1$.
$\Rightarrow y=1$.
So, the intersection point of the line $y=-2x+1$ with y-axis is $A\left( 0,1 \right)$.
Now, let us find the point at which the line intersects x-axis. We know that the value of the y-coordinate on the x-axis is zero. Let us substitute $y=0$ in the given equation to find the intersection point.
So, we get $0=-2x+1$.
$\Rightarrow 2x=1$.
$\Rightarrow x=\dfrac{1}{2}$.
So, the intersection point of the line $y=-2x+1$ with x-axis is $B\left( \dfrac{1}{2},0 \right)$.
Now, let us plot the given line by representing and joining the obtained two points on the graph which is as shown below:
Note:
Whenever we get this type of problem, we first try to find the points at which the given curve intersects both the axes. We can also plot the given equation by assuming the values for x to find the points which will help to plot on the graph. Similarly, we can expect problems to plot the function of $3y=4x+5$ on the graph.
Recently Updated Pages
Master Class 10 Social Science: Engaging Questions & Answers for Success
Master Class 10 Science: Engaging Questions & Answers for Success
Master Class 10 Maths: Engaging Questions & Answers for Success
Master Class 10 General Knowledge: Engaging Questions & Answers for Success
Master Class 10 Computer Science: Engaging Questions & Answers for Success
Class 10 Question and Answer - Your Ultimate Solutions Guide
Trending doubts
What is the full form of PNG A Petrol Natural Gas B class 10 chemistry CBSE
Explain the Treaty of Vienna of 1815 class 10 social science CBSE
In cricket, how many legal balls are there in a standard over?
Why is there a time difference of about 5 hours between class 10 social science CBSE
Who Won 36 Oscar Awards? Record Holder Revealed
What is the median of the first 10 natural numbers class 10 maths CBSE