


Plot the following graphs:
1. $P$ vs $V$
2. $P$ vs $\dfrac{1}{V}$
3. $PV$ vs $P$
Answer
566.7k+ views
Hint: Boyle’s law helps in understanding the behaviour of gases when the temperature is constant. It states that the pressure of the gas is inversely proportional to its volume when the temperature is constant.
$
P\propto V \\
P = \dfrac{k}{V} \\
PV = k \\
$Where $V$ is the volume, $P$ is the pressure and $k$ is the constant value
Complete step by step solution:
1. $P$ vs $V$:
As we know that pressure and volume of a gas is inversely proportional (According to Boyle’s law), Hence, pressure will increase as the volume decreases. The graph is as follows:
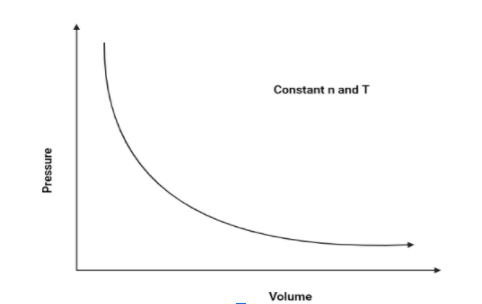
Hence, The graph of pressure vs volume will be a rectangular hyperbola.
2. $P$ vs $\dfrac{1}{V}$:
As we know that $P$ and $\dfrac{1}{V}$ is directly proportional (According to boyle’s law), Hence, pressure will increase as the volume increases.The graph is as follows:
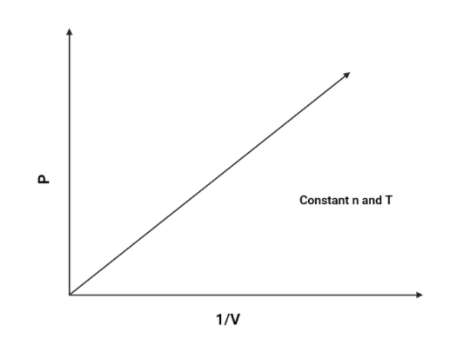
Hence, The graph of $P$ vs $\dfrac{1}{V}$ will be a linear graph.
3. $PV$ vs $P$:
As we know that $PV = k$, (According to Boyle's law). Hence the $PV$ axis will remain constant for all values of $P$. The graph is as follows:
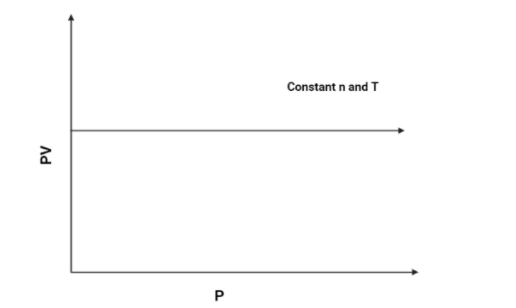
Hence, The graph of $PV$ vs $P$ will be a constant graph.
Note: Boyle’s law has many real life applications. For example, It’s being used in the medical field to check the breathing system in the human body. It helps in explaining how the air pressure within our lungs increases or decreases with respect to the volume of our lungs. This results in the difference in air pressure within our lungs and the environmental air.
$
P\propto V \\
P = \dfrac{k}{V} \\
PV = k \\
$Where $V$ is the volume, $P$ is the pressure and $k$ is the constant value
Complete step by step solution:
1. $P$ vs $V$:
As we know that pressure and volume of a gas is inversely proportional (According to Boyle’s law), Hence, pressure will increase as the volume decreases. The graph is as follows:
Hence, The graph of pressure vs volume will be a rectangular hyperbola.
2. $P$ vs $\dfrac{1}{V}$:
As we know that $P$ and $\dfrac{1}{V}$ is directly proportional (According to boyle’s law), Hence, pressure will increase as the volume increases.The graph is as follows:
Hence, The graph of $P$ vs $\dfrac{1}{V}$ will be a linear graph.
3. $PV$ vs $P$:
As we know that $PV = k$, (According to Boyle's law). Hence the $PV$ axis will remain constant for all values of $P$. The graph is as follows:
Hence, The graph of $PV$ vs $P$ will be a constant graph.
Note: Boyle’s law has many real life applications. For example, It’s being used in the medical field to check the breathing system in the human body. It helps in explaining how the air pressure within our lungs increases or decreases with respect to the volume of our lungs. This results in the difference in air pressure within our lungs and the environmental air.
Recently Updated Pages
Master Class 12 Economics: Engaging Questions & Answers for Success
Master Class 12 English: Engaging Questions & Answers for Success
Master Class 12 Social Science: Engaging Questions & Answers for Success
Master Class 12 Maths: Engaging Questions & Answers for Success
Master Class 12 Physics: Engaging Questions & Answers for Success
Master Class 11 Social Science: Engaging Questions & Answers for Success
Trending doubts
One Metric ton is equal to kg A 10000 B 1000 C 100 class 11 physics CBSE
Difference Between Prokaryotic Cells and Eukaryotic Cells
Two of the body parts which do not appear in MRI are class 11 biology CBSE
1 ton equals to A 100 kg B 1000 kg C 10 kg D 10000 class 11 physics CBSE
Draw a diagram of nephron and explain its structur class 11 biology CBSE
10 examples of friction in our daily life