


How do you plot the following graph $ x=\sqrt{y-1} $ ?
Answer
573.9k+ views
Hint: In this question, we need to plot the graph for the given equation $ x=\sqrt{y-1} $ . For this, we will take square both sides and graph for $ y={{x}^{2}}+1 $ . We will suppose some points for x and find values of y. Using the points, we will plot the graph for $ y={{x}^{2}}+1 $ which will be a parabola.
Complete step by step answer:
Here we are given the equation of the function as $ x=\sqrt{y-1} $ .
We need to draw its graph. For this let us first simplify the equation,
Squaring both sides we get $ {{x}^{2}}={{\left( \sqrt{y-1} \right)}^{2}}\Rightarrow {{x}^{2}}=y+1 $ .
Taking 1 to the other side we get $ y={{x}^{2}}+1 $ .
We need to draw a graph for this equation.
As $ {{x}^{2}} $ is positive and it is in the quadratic form so our graph shape will be an upward parabola $ \left( \bigcup \right) $ . In general form, $ y=a{{x}^{2}}+bx+c $ the bx part of the equation shifts graph left or right but here we do not have, so our graph is central about the y-axis. Since the C part is +1 so the general parabola will shift upward.
Let us find some points to plot the graph,
Taking x = 0 we get $ y={{\left( 0 \right)}^{2}}+1\Rightarrow y=1 $ .
Taking x = 1 we get $ y={{\left( 1 \right)}^{2}}+1\Rightarrow y=2 $ .
Taking x = 2 we get $ y={{\left( 2 \right)}^{2}}+1\Rightarrow y=5 $ .
Taking x = 3 we get $ y={{\left( 3 \right)}^{2}}+1\Rightarrow y=10 $ .
Taking x = -1 we get $ y={{\left( -1 \right)}^{2}}+1\Rightarrow y=2 $ .
Taking x = -2 we get $ y={{\left( -2 \right)}^{2}}+1\Rightarrow y=5 $ .
Taking x = -3 we get $ y={{\left( -3 \right)}^{2}}+1\Rightarrow y=10 $ .
So our table of points that we will plot looks like this,
Now, let us draw the y-axis as a vertical line and x-axis as the horizontal line and mark the variables O, X, Y. Let us mark relevant points for the x and y-axis. Now let us plot all the points.
After this, let us draw a smooth curve passing through these points. This graph is our final answer.
Note:
Students should always try to find a point for the negative x-axis too because as observed earlier, this parabola is centered along the y-axis. Note that for any value of x, y cannot be negative because the equation involves $ {{x}^{2}} $ only. Make sure to make a smooth curve for more accuracy, students can plot more points.
Complete step by step answer:
Here we are given the equation of the function as $ x=\sqrt{y-1} $ .
We need to draw its graph. For this let us first simplify the equation,
Squaring both sides we get $ {{x}^{2}}={{\left( \sqrt{y-1} \right)}^{2}}\Rightarrow {{x}^{2}}=y+1 $ .
Taking 1 to the other side we get $ y={{x}^{2}}+1 $ .
We need to draw a graph for this equation.
As $ {{x}^{2}} $ is positive and it is in the quadratic form so our graph shape will be an upward parabola $ \left( \bigcup \right) $ . In general form, $ y=a{{x}^{2}}+bx+c $ the bx part of the equation shifts graph left or right but here we do not have, so our graph is central about the y-axis. Since the C part is +1 so the general parabola will shift upward.
Let us find some points to plot the graph,
Taking x = 0 we get $ y={{\left( 0 \right)}^{2}}+1\Rightarrow y=1 $ .
Taking x = 1 we get $ y={{\left( 1 \right)}^{2}}+1\Rightarrow y=2 $ .
Taking x = 2 we get $ y={{\left( 2 \right)}^{2}}+1\Rightarrow y=5 $ .
Taking x = 3 we get $ y={{\left( 3 \right)}^{2}}+1\Rightarrow y=10 $ .
Taking x = -1 we get $ y={{\left( -1 \right)}^{2}}+1\Rightarrow y=2 $ .
Taking x = -2 we get $ y={{\left( -2 \right)}^{2}}+1\Rightarrow y=5 $ .
Taking x = -3 we get $ y={{\left( -3 \right)}^{2}}+1\Rightarrow y=10 $ .
So our table of points that we will plot looks like this,
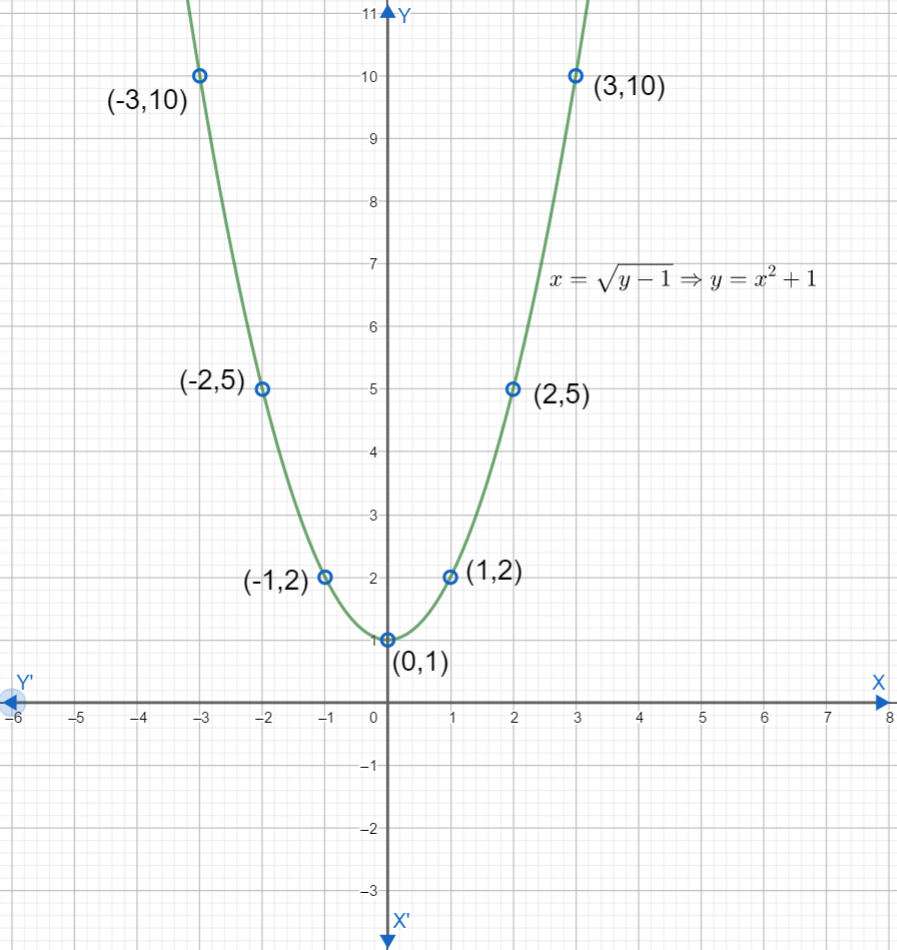
| x | -3 | -2 | -1 | 0 | 1 | 2 | 3 |
| y | 10 | 5 | 2 | 1 | 2 | 5 | 10 |
Now, let us draw the y-axis as a vertical line and x-axis as the horizontal line and mark the variables O, X, Y. Let us mark relevant points for the x and y-axis. Now let us plot all the points.
After this, let us draw a smooth curve passing through these points. This graph is our final answer.
Note:
Students should always try to find a point for the negative x-axis too because as observed earlier, this parabola is centered along the y-axis. Note that for any value of x, y cannot be negative because the equation involves $ {{x}^{2}} $ only. Make sure to make a smooth curve for more accuracy, students can plot more points.
Recently Updated Pages
Basicity of sulphurous acid and sulphuric acid are
Master Class 10 English: Engaging Questions & Answers for Success
Master Class 10 Social Science: Engaging Questions & Answers for Success
Master Class 10 Computer Science: Engaging Questions & Answers for Success
Class 10 Question and Answer - Your Ultimate Solutions Guide
Master Class 10 General Knowledge: Engaging Questions & Answers for Success
Trending doubts
Which country won the ICC Men's ODI World Cup in 2023?
In cricket, how many legal balls are there in a standard over?
Explain the Treaty of Vienna of 1815 class 10 social science CBSE
A boat goes 24 km upstream and 28 km downstream in class 10 maths CBSE
What does "powerplay" mean in limited-overs cricket?
What is the "Powerplay" in T20 cricket?