


How to plot points for half life graphs?
Answer
566.7k+ views
Hint: The half life graph is plotted for a radioactive substance. The time taken by a radioactive substance to decay to half of its amount is known as its half life. It is a constant quantity and in order to plot its graph, time is the independent variable and amount of substance is the dependent variable.
Complete answer:
The half life of a radioactive substance is the time taken by it to decompose to half of its amount. It is given by-
${{t}_{1/2}}=\dfrac{\ln (2)}{\lambda }$
Here, ${{t}_{1/2}}$ is the half life
$\lambda $ is the decay constant of the substance
The half life of a substance is a constant quantity, therefore, for the amount at a specific time it would take time equal to half life to decompose to half its value. In order to plot a graph for the half life of a substance, we take the amount of the substance on the y-axis and the time will be taken on the x-axis as time is the independent variable and amount of substance is the independent variable.
Let us assume at the amount of a substance is $x$, then it decomposes to $\dfrac{x}{2}$ in time ${{t}_{1/2}}$.So, the first points are $(x,0)$ and $(\dfrac{x}{2},\,{{t}_{1/2}})$. Now the amount of substance is $\dfrac{x}{2}$ and it will reduce to its half in the next half life, so the next point will be $(\dfrac{x}{4},2\,{{t}_{1/2}})$ and plotting all points similarly, we will get an exponential graph.
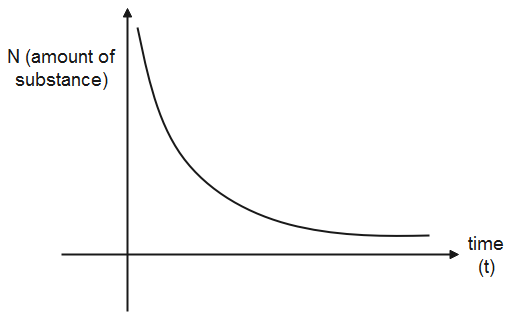
Therefore, when the half life points are plotted, it gives an exponential graph.
Note:
The decay constant is the probability of decay of a radioactive substance in unit time. The mean half life is the average time that a radioactive substance will take to completely disappear. The rate of decay is directly proportional to the number of atoms of the amount present at a specific time.
Complete answer:
The half life of a radioactive substance is the time taken by it to decompose to half of its amount. It is given by-
${{t}_{1/2}}=\dfrac{\ln (2)}{\lambda }$
Here, ${{t}_{1/2}}$ is the half life
$\lambda $ is the decay constant of the substance
The half life of a substance is a constant quantity, therefore, for the amount at a specific time it would take time equal to half life to decompose to half its value. In order to plot a graph for the half life of a substance, we take the amount of the substance on the y-axis and the time will be taken on the x-axis as time is the independent variable and amount of substance is the independent variable.
Let us assume at the amount of a substance is $x$, then it decomposes to $\dfrac{x}{2}$ in time ${{t}_{1/2}}$.So, the first points are $(x,0)$ and $(\dfrac{x}{2},\,{{t}_{1/2}})$. Now the amount of substance is $\dfrac{x}{2}$ and it will reduce to its half in the next half life, so the next point will be $(\dfrac{x}{4},2\,{{t}_{1/2}})$ and plotting all points similarly, we will get an exponential graph.
Therefore, when the half life points are plotted, it gives an exponential graph.
Note:
The decay constant is the probability of decay of a radioactive substance in unit time. The mean half life is the average time that a radioactive substance will take to completely disappear. The rate of decay is directly proportional to the number of atoms of the amount present at a specific time.
Recently Updated Pages
Master Class 12 Business Studies: Engaging Questions & Answers for Success
Master Class 12 Biology: Engaging Questions & Answers for Success
Master Class 12 Chemistry: Engaging Questions & Answers for Success
Class 12 Question and Answer - Your Ultimate Solutions Guide
Master Class 11 Social Science: Engaging Questions & Answers for Success
Master Class 11 English: Engaging Questions & Answers for Success
Trending doubts
Which is more stable and why class 12 chemistry CBSE
Which are the Top 10 Largest Countries of the World?
Draw a labelled sketch of the human eye class 12 physics CBSE
Differentiate between homogeneous and heterogeneous class 12 chemistry CBSE
What are the major means of transport Explain each class 12 social science CBSE
Sulphuric acid is known as the king of acids State class 12 chemistry CBSE