


What is the parent graph of a square root function?
Answer
560.4k+ views
Hint: Parent functions are the simplest form of family of functions. The parent graph of a square root equation is symmetric about any one of axes. While tracing the graph we have to plot the points exactly. It looks like a parabola.
Complete step by step solution:
From the question it is clear that we have to find the parent graph of square root function.
now let us take the as \[f\left( x \right)=\sqrt{x}\]
let us assume \[f\left( x \right)=y\]
so, the equation becomes \[y=\sqrt{x}\].
Squaring on both sides
We get the equation as \[{{y}^{2}}=x\].
Now we need to find the domain of this square root function. The domain is found by realizing that the function is only defined when the expression inside the square root is greater than or equals zero.
Since the expression inside the root is just \[x\], that means the domain is all values of \[x\]such that \[x\ge 0\].
This means we should pick \[x\] values greater than or equal to zero.
Now let us take some \[x\] values and try to find \[y\] values.
At \[x=0\] we get \[y=\sqrt{0}\] that is equal to \[0\]
At \[x=2\] we get \[y=\sqrt{2}\] that is equal to \[1.4\]
At \[x=4\] we get\[y=\sqrt{4}\] that is equal to \[2\]
At \[x=9\]we get \[y=\sqrt{9}\] that is equal to \[3\]
Now let us try to plot these values on graph
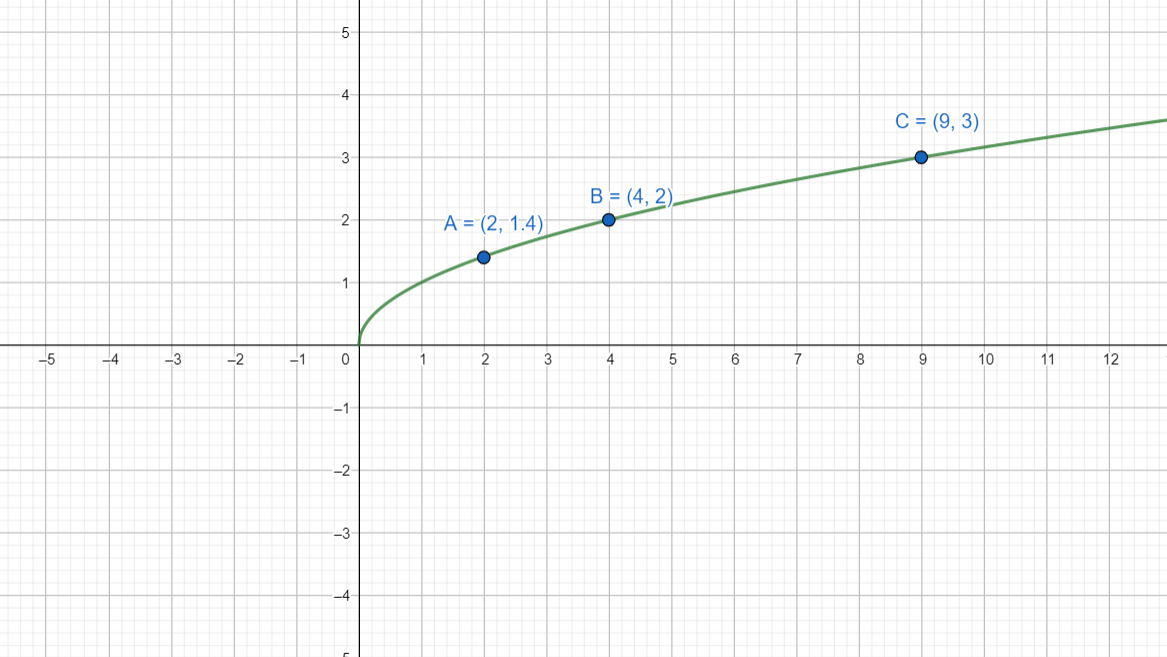
The graph of the square is always curved.the curve above looks like half of a parabola lying on its side.
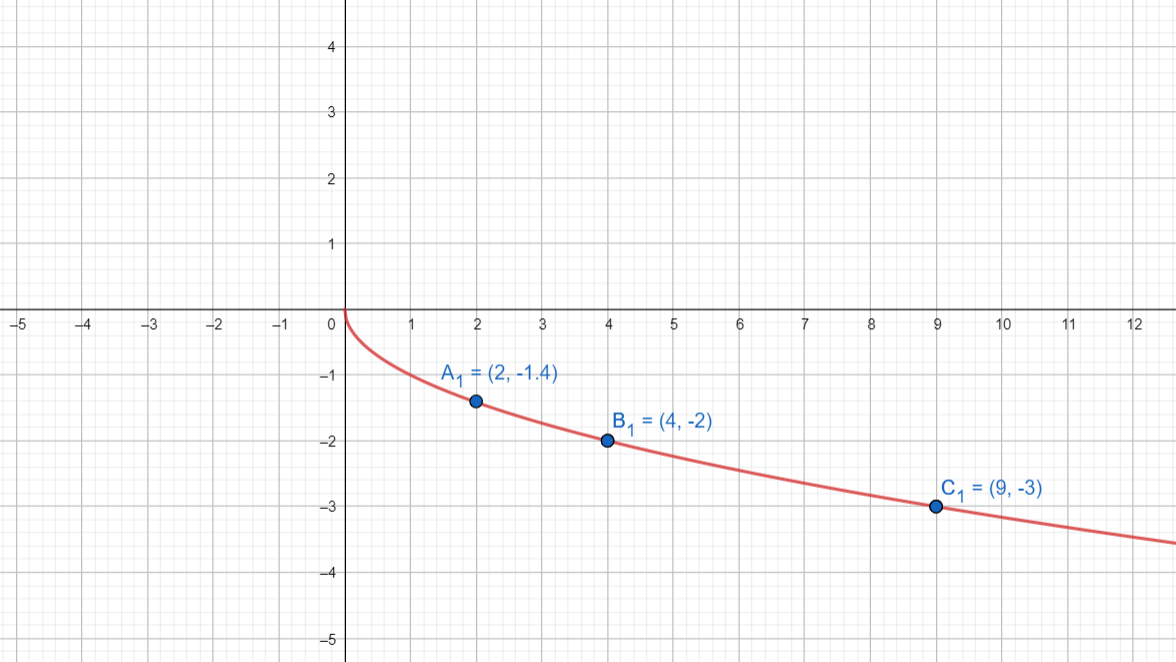
Graph of \[y=-\sqrt{x}\] is the remaining half of that parabola. so let us try to plot the graph of a \[y=-\sqrt{x}\].
At \[x=0\] we get \[y=-\sqrt{0}\] that is equal to \[0\]
At \[x=2\] we get \[y=-\sqrt{2}\] that is equal to \[-1.4\]
At \[x=4\] we get \[y=-\sqrt{4}\] that is equal to \[-2\]
At \[x=9\]we get \[y=-\sqrt{9}\] that is equal to \[-3\]
Now let us try to put these values on a graph.
The combined graph is a complete parabola
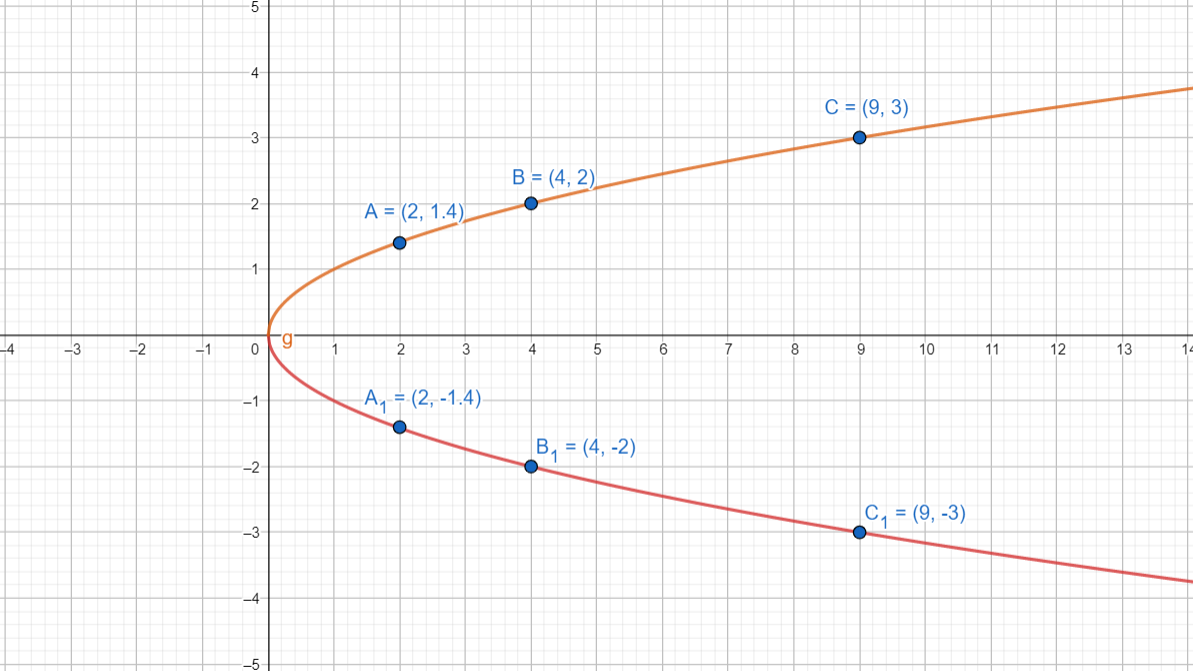
Note: Students should plot the points carefully on a graph sheet. Students should avoid calculation mistakes to get the accurate points. Many students will consider only \[f\left( x \right)=\sqrt{x}\] but we should also consider \[f\left( x \right)=-\sqrt{x}\], then only we will get a complete graph.
Complete step by step solution:
From the question it is clear that we have to find the parent graph of square root function.
now let us take the as \[f\left( x \right)=\sqrt{x}\]
let us assume \[f\left( x \right)=y\]
so, the equation becomes \[y=\sqrt{x}\].
Squaring on both sides
We get the equation as \[{{y}^{2}}=x\].
Now we need to find the domain of this square root function. The domain is found by realizing that the function is only defined when the expression inside the square root is greater than or equals zero.
Since the expression inside the root is just \[x\], that means the domain is all values of \[x\]such that \[x\ge 0\].
This means we should pick \[x\] values greater than or equal to zero.
Now let us take some \[x\] values and try to find \[y\] values.
At \[x=0\] we get \[y=\sqrt{0}\] that is equal to \[0\]
At \[x=2\] we get \[y=\sqrt{2}\] that is equal to \[1.4\]
At \[x=4\] we get\[y=\sqrt{4}\] that is equal to \[2\]
At \[x=9\]we get \[y=\sqrt{9}\] that is equal to \[3\]
Now let us try to plot these values on graph
The graph of the square is always curved.the curve above looks like half of a parabola lying on its side.
Graph of \[y=-\sqrt{x}\] is the remaining half of that parabola. so let us try to plot the graph of a \[y=-\sqrt{x}\].
At \[x=0\] we get \[y=-\sqrt{0}\] that is equal to \[0\]
At \[x=2\] we get \[y=-\sqrt{2}\] that is equal to \[-1.4\]
At \[x=4\] we get \[y=-\sqrt{4}\] that is equal to \[-2\]
At \[x=9\]we get \[y=-\sqrt{9}\] that is equal to \[-3\]
Now let us try to put these values on a graph.
The combined graph is a complete parabola
Note: Students should plot the points carefully on a graph sheet. Students should avoid calculation mistakes to get the accurate points. Many students will consider only \[f\left( x \right)=\sqrt{x}\] but we should also consider \[f\left( x \right)=-\sqrt{x}\], then only we will get a complete graph.
Recently Updated Pages
Master Class 12 Economics: Engaging Questions & Answers for Success
Master Class 12 English: Engaging Questions & Answers for Success
Master Class 12 Social Science: Engaging Questions & Answers for Success
Master Class 12 Maths: Engaging Questions & Answers for Success
Master Class 12 Physics: Engaging Questions & Answers for Success
Master Class 10 English: Engaging Questions & Answers for Success
Trending doubts
Explain the Treaty of Vienna of 1815 class 10 social science CBSE
Why is it 530 pm in india when it is 1200 afternoon class 10 social science CBSE
What is the full form of POSCO class 10 social science CBSE
Define Potential, Developed, Stock and Reserved resources
Which Country Has the Largest Border with India?
Choose the feminine form of the given noun Fox AFoxess class 10 english CBSE