


One hundred management students who read at least one of the three business magazines are surveyed to study the relationship pattern. It is found that 80 read Business India, 50 read Business World, and 30 read Business Today. Five students read all the magazines. How many read exactly two magazines?
A) 50
B) 10
C) 95
D) 25
Answer
587.1k+ views
Hint:
It is given in the question that One hundred management students who read at least one of the three business magazines are surveyed to study the relationship pattern. It is found that 80 read Business India, 50 read Business World, and 30 read Business Today. Five students read all the magazines. We are asked to find the number of students who read exactly two magazines out of the given magazines.
This question is solved by using the Venn Diagram.
Venn Diagram: Venn diagram is also called Primary diagram, Set Diagram or Logic Diagram, is a diagram that shows all possible logical relations between a finite collection of different sets.
Complete step by step solution:
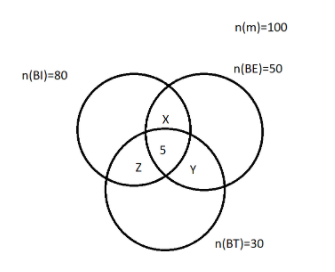
Let, M denote all the three magazines, BI denote magazine named Business India, BW denotes magazine named Business World, BT denotes magazine named Business Today
$n\left( M \right) = 100$
$
n\left( {BI} \right) = 80 \\
n\left( {BW} \right) = 50 \\
n\left( {BT} \right) = 30 \\
$
From the figure, we get
$n\left( M \right) = n\left( {BI} \right) + n\left( {BW} \right) + n\left( {BT} \right) - \left( {x + 5} \right) - \left( {y + 5} \right) - \left( {z + 5} \right) + 5$
$100 = 80 + 50 + 30 - \left( {x + 5} \right) - \left( {y + 5} \right) - \left( {z + 5} \right) + 5$
Make $x + y + z$ as a subject,
$x + y + z = 80 + 50 + 30 + 5 - 15 - 100$
$ \Rightarrow x + y + z = 50$
Hence, number of persons who read exactly two magazines = 50 persons.
Note:
A Venn diagram consists of multiple overlapping closed curves, usually circles, each representing a set. The point inside a curve labelled as S represents elements of the set S, while the point outside the boundary represents elements that are not in the set S.
It is given in the question that One hundred management students who read at least one of the three business magazines are surveyed to study the relationship pattern. It is found that 80 read Business India, 50 read Business World, and 30 read Business Today. Five students read all the magazines. We are asked to find the number of students who read exactly two magazines out of the given magazines.
This question is solved by using the Venn Diagram.
Venn Diagram: Venn diagram is also called Primary diagram, Set Diagram or Logic Diagram, is a diagram that shows all possible logical relations between a finite collection of different sets.
Complete step by step solution:
Let, M denote all the three magazines, BI denote magazine named Business India, BW denotes magazine named Business World, BT denotes magazine named Business Today
$n\left( M \right) = 100$
$
n\left( {BI} \right) = 80 \\
n\left( {BW} \right) = 50 \\
n\left( {BT} \right) = 30 \\
$
From the figure, we get
$n\left( M \right) = n\left( {BI} \right) + n\left( {BW} \right) + n\left( {BT} \right) - \left( {x + 5} \right) - \left( {y + 5} \right) - \left( {z + 5} \right) + 5$
$100 = 80 + 50 + 30 - \left( {x + 5} \right) - \left( {y + 5} \right) - \left( {z + 5} \right) + 5$
Make $x + y + z$ as a subject,
$x + y + z = 80 + 50 + 30 + 5 - 15 - 100$
$ \Rightarrow x + y + z = 50$
Hence, number of persons who read exactly two magazines = 50 persons.
Note:
A Venn diagram consists of multiple overlapping closed curves, usually circles, each representing a set. The point inside a curve labelled as S represents elements of the set S, while the point outside the boundary represents elements that are not in the set S.
Recently Updated Pages
Basicity of sulphurous acid and sulphuric acid are
Master Class 11 Business Studies: Engaging Questions & Answers for Success
Master Class 11 Computer Science: Engaging Questions & Answers for Success
Master Class 11 Economics: Engaging Questions & Answers for Success
Master Class 11 Social Science: Engaging Questions & Answers for Success
Master Class 11 English: Engaging Questions & Answers for Success
Trending doubts
Draw a diagram of nephron and explain its structur class 11 biology CBSE
Explain zero factorial class 11 maths CBSE
Chemical formula of Bleaching powder is A Ca2OCl2 B class 11 chemistry CBSE
Name the part of the brain responsible for the precision class 11 biology CBSE
The growth of tendril in pea plants is due to AEffect class 11 biology CBSE
One Metric ton is equal to kg A 10000 B 1000 C 100 class 11 physics CBSE