


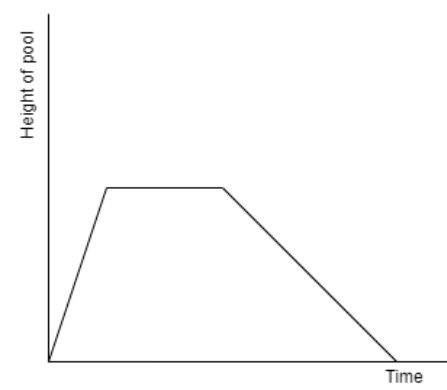
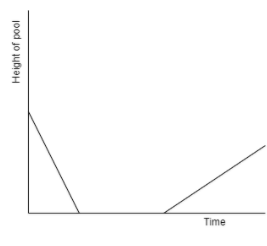
Jacob works as a lifeguard at a local pool. At the beginning of a 12-hour overnight shift, the pool was full, and Jacob began draining it. After 2 hours, the pool was completely empty. He spent 3 hours cleaning the pool and began filling it up again. The pool finished filling just as his shift ended. Which of the following graph accurately describes the amount of water in the pool throughout the Jacob shift?
(a)
(b)
(c)
(d)
(e)
Answer
577.8k+ views
Hint: We solve this problem by taking the coordinates of points from the start of shift to the end of shift. Let us assume that the height of the pool is ‘H’ which is at the start of the shift. We have three parts first draining the tank, second cleaning, and third filling the tank. We take the coordinates of points in each part to draw the graph required with the slope of the line.
Complete step-by-step solution:
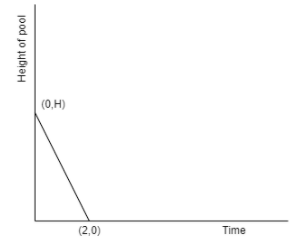
Let us assume that the height of the tank is \['H'\] which is full initially.
We are given that first Jacob drains the tank then cleans and again fills the tank.
Here, we can see that there are three parts.
Let us consider the first part
(i) Draining the tank
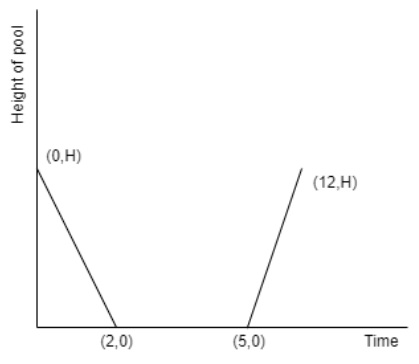
We are given that the tank is full initially at the time \[t=0\] so we can say that the initial coordinates are \[\left( 0, H \right)\]
We are given that the tank is completely drained in 2 hours.
So, we can write the final co – ordinates as \[\left( 2,0 \right)\]
Now, let us calculate the slope as
\[\begin{align}
& \Rightarrow {{m}_{1}}=\dfrac{0-H}{2-0} \\
& \Rightarrow {{m}_{1}}=-\dfrac{H}{2} \\
\end{align}\]
Now, let us draw the rough graph having the slope \[-\dfrac{H}{2}\] as shown below.
Now, let us go to the second part.
(ii) Cleaning process
Initially, the tank is empty so, we can take the initial coordinates as \[\left( 2,0 \right)\]
We are given that Jacob cleans the tank in 3 hours.
So, we can see that there is a total of 5 hours completed in Jacob’s shift.
Si, we can take the final coordinates as \[\left( 5,0 \right)\]
Here, we can see that the slope is ‘0’
Now, by constructing the rough graph up to this point we get
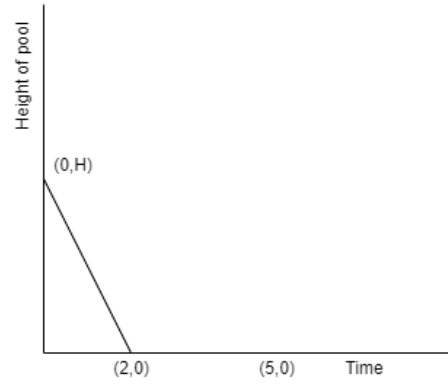
Here, we cannot see the graph of the second part because it merges with the X-axis.
Now, let us go to the third party.
(iii) Filling the tank.
We know that initial coordinates are final coordinates of the second part that is \[\left( 5,0 \right)\]
We are given that the tank is filled just when Jacob’s shift is completed, which is 12 hours.
So, we can take the final co – ordinates as \[\left( 12,H \right)\]
Now, by calculating the slope we get
\[\begin{align}
& \Rightarrow {{m}_{2}}=\dfrac{H-0}{12-5} \\
& \Rightarrow {{m}_{2}}=\dfrac{H}{7} \\
\end{align}\]
Here, we can see that relation of modulus of slopes as
\[\Rightarrow \left| {{m}_{1}} \right|>\left| {{m}_{2}} \right|\]
Here, we can see that the line equation having slope \[{{m}_{2}}\] is more leaned towards the X – axis than the line equation having slope \[{{m}_{1}}\]
So, by drawing the rough graph up to three parts we get
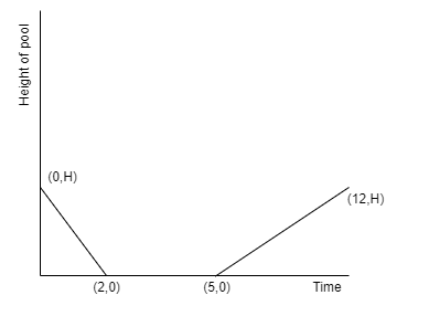
Therefore, option (e) is the correct answer.
Note: Students may make mistakes in drawing the graph of the third party. Based on the slope \[{{m}_{2}}\] we have two possibilities of graphs that is
(i)
(ii)
The graph that is drawn in (i) is wrong because of the slope.
We have the relationship between the slopes as
\[\Rightarrow \left| {{m}_{1}} \right|>\left| {{m}_{2}} \right|\]
This means that the line equation having slope \[{{m}_{2}}\] is more leaned towards the X-axis than the line equation having slope \[{{m}_{1}}\]
So the correct graph will be
His part needs to be taken care of which involves the slopes of line equations.
Complete step-by-step solution:
Let us assume that the height of the tank is \['H'\] which is full initially.
We are given that first Jacob drains the tank then cleans and again fills the tank.
Here, we can see that there are three parts.
Let us consider the first part
(i) Draining the tank
We are given that the tank is full initially at the time \[t=0\] so we can say that the initial coordinates are \[\left( 0, H \right)\]
We are given that the tank is completely drained in 2 hours.
So, we can write the final co – ordinates as \[\left( 2,0 \right)\]
Now, let us calculate the slope as
\[\begin{align}
& \Rightarrow {{m}_{1}}=\dfrac{0-H}{2-0} \\
& \Rightarrow {{m}_{1}}=-\dfrac{H}{2} \\
\end{align}\]
Now, let us draw the rough graph having the slope \[-\dfrac{H}{2}\] as shown below.
Now, let us go to the second part.
(ii) Cleaning process
Initially, the tank is empty so, we can take the initial coordinates as \[\left( 2,0 \right)\]
We are given that Jacob cleans the tank in 3 hours.
So, we can see that there is a total of 5 hours completed in Jacob’s shift.
Si, we can take the final coordinates as \[\left( 5,0 \right)\]
Here, we can see that the slope is ‘0’
Now, by constructing the rough graph up to this point we get
Here, we cannot see the graph of the second part because it merges with the X-axis.
Now, let us go to the third party.
(iii) Filling the tank.
We know that initial coordinates are final coordinates of the second part that is \[\left( 5,0 \right)\]
We are given that the tank is filled just when Jacob’s shift is completed, which is 12 hours.
So, we can take the final co – ordinates as \[\left( 12,H \right)\]
Now, by calculating the slope we get
\[\begin{align}
& \Rightarrow {{m}_{2}}=\dfrac{H-0}{12-5} \\
& \Rightarrow {{m}_{2}}=\dfrac{H}{7} \\
\end{align}\]
Here, we can see that relation of modulus of slopes as
\[\Rightarrow \left| {{m}_{1}} \right|>\left| {{m}_{2}} \right|\]
Here, we can see that the line equation having slope \[{{m}_{2}}\] is more leaned towards the X – axis than the line equation having slope \[{{m}_{1}}\]
So, by drawing the rough graph up to three parts we get
Therefore, option (e) is the correct answer.
Note: Students may make mistakes in drawing the graph of the third party. Based on the slope \[{{m}_{2}}\] we have two possibilities of graphs that is
(i)
(ii)
The graph that is drawn in (i) is wrong because of the slope.
We have the relationship between the slopes as
\[\Rightarrow \left| {{m}_{1}} \right|>\left| {{m}_{2}} \right|\]
This means that the line equation having slope \[{{m}_{2}}\] is more leaned towards the X-axis than the line equation having slope \[{{m}_{1}}\]
So the correct graph will be
His part needs to be taken care of which involves the slopes of line equations.
Recently Updated Pages
Master Class 10 Computer Science: Engaging Questions & Answers for Success
Master Class 10 General Knowledge: Engaging Questions & Answers for Success
Master Class 10 English: Engaging Questions & Answers for Success
Master Class 10 Social Science: Engaging Questions & Answers for Success
Master Class 10 Maths: Engaging Questions & Answers for Success
Master Class 10 Science: Engaging Questions & Answers for Success
Trending doubts
What is the median of the first 10 natural numbers class 10 maths CBSE
Which women's tennis player has 24 Grand Slam singles titles?
Who is the Brand Ambassador of Incredible India?
Why is there a time difference of about 5 hours between class 10 social science CBSE
Write a letter to the principal requesting him to grant class 10 english CBSE
State and prove converse of BPT Basic Proportionality class 10 maths CBSE