




In Lothar Meyer’s plot, the positions at the peaks are occupied by:
(a) Alkali metals
(b) Alkaline earth metals
(c) Halogens
(d) Noble gases
Answer
 Verified
582.3k+ views
Hint: As we know that Lothar Meyer arranged the elements according to the similarity in their properties. He also considered assigning the particular positions to a group of elements with respect to their similarities. So here we have to tell about the elements that took positions at the peak.
Complete answer:
Let us discuss about the In Lothar Meyer’s plot as follows:-
-Lothar Meyer was the first person to observe periodic trends in properties of various elements found till then and plotted a graph between their atomic masses and physical properties such as boiling point, melting point etc.
The Lothar Meyer’s curve is shown below:-
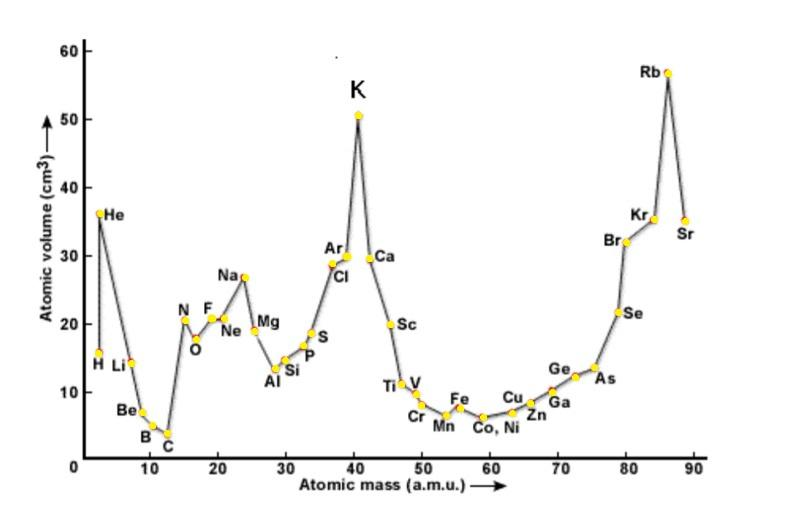
-He proposed this by arranging the elements in order of their increasing atomic weights along with the similarities in physical and chemical properties.
- It can be seen that the curve of halogens are placed at similar positions that is at the ascending part of the curve due to their similarities.
- Also alkali metals were seen to be at the peak positions and alkaline earth metals were placed at the descending of the plot curve.
From the above data we can conclude that in Lothar Meyer’s plot, the positions at the peaks are occupied by: (a) Alkali metals.
Note:
-Lothar Meyer observed change in length and the repeating pattern of properties, unlike Newlands who introduced us to Newland's law of octaves.
-Also noble gases are placed just before the alkali metals in the plot curve.
Complete answer:
Let us discuss about the In Lothar Meyer’s plot as follows:-
-Lothar Meyer was the first person to observe periodic trends in properties of various elements found till then and plotted a graph between their atomic masses and physical properties such as boiling point, melting point etc.
The Lothar Meyer’s curve is shown below:-
-He proposed this by arranging the elements in order of their increasing atomic weights along with the similarities in physical and chemical properties.
- It can be seen that the curve of halogens are placed at similar positions that is at the ascending part of the curve due to their similarities.
- Also alkali metals were seen to be at the peak positions and alkaline earth metals were placed at the descending of the plot curve.
From the above data we can conclude that in Lothar Meyer’s plot, the positions at the peaks are occupied by: (a) Alkali metals.
Note:
-Lothar Meyer observed change in length and the repeating pattern of properties, unlike Newlands who introduced us to Newland's law of octaves.
-Also noble gases are placed just before the alkali metals in the plot curve.
Recently Updated Pages
Master Class 11 Social Science: Engaging Questions & Answers for Success

Master Class 11 English: Engaging Questions & Answers for Success
Master Class 11 Accountancy: Engaging Questions & Answers for Success
Master Class 11 Physics: Engaging Questions & Answers for Success
Master Class 11 Computer Science: Engaging Questions & Answers for Success
Master Class 11 Business Studies: Engaging Questions & Answers for Success
Trending doubts
One Metric ton is equal to kg A 10000 B 1000 C 100 class 11 physics CBSE
Find the value of the expression given below sin 30circ class 11 maths CBSE
Draw a diagram of nephron and explain its structur class 11 biology CBSE
10 examples of friction in our daily life
Proton was discovered by A Thomson B Rutherford C Chadwick class 11 chemistry CBSE
The teeth used for biting and cutting food are called class 11 biology CBSE